 | 27 Oct 2026
D-KULT: data and tools for routine eco-efficient flight operations

Klaus Gierens
Christine Frömming
Björn Beckmann
Luca Bugliaro
Katrin Dahlmann
Simone Dietmüller
Maleen Hanst
Sina Hofer
Julian Jene
Simon Kirschler
Carmen G. Köhler
Alexander Lau
Ralph Leemüller
Aline Liedtke
Maximilian Mendiguchia Meuser
Patrick Peter
Vanessa Santos Gabriel
Ines Köhler
Gerd Saueressig
Linda Schlemmer
Jonas Sperling
Swen Schlobach
Ralph Schultz
Kristina von Sack
Nathalie Waltenberg
Zarah Zengerling
The climate effect of aviation is significant and expected to increase. Reducing the sector's environmental footprint to contribute to global temperature targets will require not only investments in airframe and engine technologies but also operational strategies such as eco-efficient flight routing. The D-KULT project (Demonstrator Climate and Environmentally Friendly Air Transport), funded under the German Federal Aviation Research Programme (LuFo) demonstrated the operational feasibility of integrating climate-response estimates of non-CO2 effects into flight trajectory optimisation in practice. The project addressed a multi-objective optimisation problem. Flight trajectories were optimised to minimise climate effects based on climate response estimates from numerical models while maintaining operational and economic efficiency. Operational constraints such as meteorological hazards, regulatory requirements, airspace and airport capacity were incorporated to ensure real-world applicability.
D-KULT developed an end-to-end information chain integrating aviation weather forecasting, flight planning, air traffic control, and climate benefit assessment to enable eco-efficient flight routing for testing purposes. Achieving this complex operational and environmental objective required close collaboration across multiple disciplines and substantial upgrades to the majority of participating components. Advanced aviation weather products were generated that estimate the climate response to emissions under prevailing meteorological conditions. Flight planning tools have been extended to incorporate this information in addition to the standard data used in the flight planning optimization algorithms. In this way, flight planning tools can calculate emissions and corresponding climate effects along flights, both as part of pre-tactical and tactical (pre-take-off and in-flight) eco-efficient flight optimisation. Developments within D-KULT were tested through a large-scale national contrail avoidance flight trial campaign (TF-100 with 108 flights), including enhanced satellite-based contrail detection methods and assessment of estimates of climate benefits. Further evaluation focused on operational integration, examining air traffic control procedures, and workflow implications in a high-fidelity simulator environment.
This manuscript provides a comprehensive overview of the project, describes new developments and major challenges on implementation pathways, summarizes key findings and gives recommendations derived from practical implementation. Issues that still need to be solved are: Aviation weather forecast should be based on improved cloud microphysics representing ice supersaturation correctly, humidity measurements at cruise altitudes are required for data assimilation, the geographical and temporal scope of implemented response tools needs to be extended. Since different meteorological input data and different response tools lead to differing assessments of climate benefits and damages, such sensitivities need to be considered in accordance with a thorough uncertainty analysis. For future implementation practical obstacles are the automation of procedures, the increase of workload for controllers if climate sensitive sectors need to be kept clear of aircraft, and the subject of standardization.
- Article
(4015 KB) - Full-text XML
- BibTeX
- EndNote


The climate effect of air transport is undisputed: Aviation contributes currently about 3.5 % to the total anthropogenic effective radiative forcing of climate (Lee et al., 2021). This share will continue to grow due to the high demand and its rate of increase, both in absolute terms and in relation to other modes of transport and industrial sectors (Grewe et al., 2021; Klöwer et al., 2021). Under the Paris Agreement, governments have agreed to minimise the anthropogenic temperature increase in the atmosphere to well below 2 °C, 1.5 °C, if possible (United Nations, 2015). Air traffic must make its contribution, but it turns out that the 1.5 °C target for aviation is very ambitious and that technological improvements alone do not suffice to let aviation meet its environmental goals (Grewe et al., 2021; ICCT, 2025). Eco-efficient flight routing (i.e. avoiding climate-sensitive areas when planning flights) is considered an additional way for air traffic to approach this target.
For competition and cost reasons, the aviation industry is continuously introducing more fuel-efficient aircraft with ever lower specific fuel consumption (that is, fuel need per passenger-km), thereby focussing on a corresponding reduction in specific CO2 emissions (ITF, 2012). At the same time, climate effect of aviation caused by CO2 and non-CO2 effects is a matter of concern and a research topic since at least the 1990s (Schumann, 1994) and the level of scientific understanding of non-CO2 effects was still considered low (Lee et al., 2010). Hence, identification of alternative eco-efficient aircraft trajectories with lower climate effects exploring mitigation potentials from non-CO2 climate effects remained complex and a field for theoretical studies and scientific experiments for many years.
Planning and flying eco-efficient routes are primarily tasks for airlines and air traffic control. However, this is not possible without a meteorological service providing climate response functions (Matthes et al., 2012). These functions estimate where aircraft emissions induce relatively large or relatively small climate impacts. Such information can be cast into climate-cost functions which can be applied in flight-routing software to find, for any given origin-destination pair, an eco-efficient route, i.e., a route that minimizes climate effects without increasing costs too much. Such strategies have been investigated in theoretical settings in the past (Sausen et al., 1994, 1996; Williams et al., 2002, 2003; Fichter et al., 2005; Grewe et al., 2014, 2017; Frömming et al., 2012, 2021; Arrowsmith et al., 2020; Teoh et al., 2020; Yamashita et al., 2021; Matthes et al., 2020, 2021; Rao et al., 2022). Now it is time to enter practice.
Eco-efficient flight planning depends on a coordinated workflow that enables real-time information sharing and cross-functional collaboration among stakeholders, from meteorologists and climate scientists to flight planners, airlines, dispatchers and ground operations. The LuFo project D-KULT (Demonstrator Climate and Environmentally Friendly Air Transport – funded by the German Federal Aviation Research Programme – LuFo), with its interdisciplinary consortium establishes such a collaborative workflow, for the first time, by expanding operational datasets, and operational flight planning tools, by developing procedures that can be applied under realistic operational conditions. Undoubtedly, the highest priority remains that flight operations and flight routes must be legal, flyable, and safe. Under this condition, eco-efficient route planning and tactical measures can be added to flight route management, and airlines and air navigation service providers must establish efficient and robust decision-making processes for this purpose. Therefore, air traffic management and control need to be involved in the development of procedures for eco-efficient flying to assess if developed procedures work. This is the goal, which has been defined for the information chain in D-KULT.
Safety aspects that are also considered within the framework of D-KULT relate to the handling of thunderstorms along the flight route and the radiation exposure of flying personnel. D-KULT additionally covers the aspect of noise of taking-off and landing aircraft. These additional aspects are described elsewhere in order not to overload the present paper.
This concept paper aims to advance climate-optimized flight planning by introducing an integrated collaborative workflow through modifying, advancing and connecting state-of-the-art operational methodologies, available data products and their interfaces. It is important that those responsible for these components work closely together and build a mutual understanding, especially at the interfaces. The collaborative chain and its components are introduced in detail, presenting implementation options for distinct flight planning phases, introducing evaluation and validation methodologies, while assessing extensively challenges and recommendations for future development and operational integration.
This study focuses exclusively on implementation pathways for integrating eco-efficient routing into flight planning, rather than validating real-world climate effects. While we utilize estimates from numerical models, the quantitative climate response predictions derived from these tools are not assessed or verified herein. Instead, our contribution establishes the collaborative frameworks, data workflows, and procedural concepts required to integrate climate-optimized trajectory planning into future air traffic management systems.
Section 2 gives an overview of the integrated collaboration chain established within D-KULT, which expands existing aviation weather forecast, climate response calculations, flight planning and in-flight optimization capabilities for climate-optimized flight trajectories. Section 3 presents the current status, new developments and implementation of aviation weather forecast and climate response calculation. Section 4 describes current status, developments and application of resources used for flight planning, optimization and air traffic control, while Sect. 5 presents existing and advanced contrail detection methods for validation of contrail avoidance. The workflow including enhanced data and methods was tested experimentally with prototype versions of the optimization tools. The new achievements are discussed in Sect. 6 before a summary and conclusions (recommendations) are given in the final Sect. 7.
The aim of flight routing is cost optimization (specific for each airline focussing on metrics such as fuel, time or total costs) and the meteorological services provide mainly forecasts of wind, temperature and pressure, which suffices for that purpose.
Several research and development projects explored the feasibility of theoretically integrating available information on weather and dedicated climate response estimates into existing flight planning and ATM (Air traffic management) processes to avoid climate-sensitive regions (Matthes et al., 2012). An overview on research initiatives is given in Simorgh et al. (2022). D-KULT's objective is to investigate the practical feasibility of eco-efficient flight planning and the transition from theoretical to practical implementation in real operations and its impact on flight operations and airspace as a whole. The operational time horizons and routine integration of weather forecasts define the temporal window into which additional data, processes and tools must be embedded without disrupting existing procedures.
Within the D-KULT consortium, this collaborative workflow involves the National Meteorological Service Provider (DWD), climate research and aviation research institutes (DLR), flight planning software developers (Lufthansa Systems and PACE), airlines (Lufthansa) and air traffic control (DFS). The workflow begins with aviation weather information, as it is provided routinely to airspace users and aviation stakeholders. These meteorological data are supplemented with some special forecast fields (related to the formation potential of persistent contrails and other non-CO2 effects, see below), which are needed to formulate climate cost functions (van Manen and Grewe, 2019; Dietmüller et al., 2023; Yin et al., 2023). The latter are then employed in the pre-tactical flight planning process for eco-efficient routing or in tactical in-flight profile optimization (to avoid flying in climate sensitive regions). As a prerequisite for climate-optimization, the D-KULT partners first started the development and implementation of an expanded meteorological (MET) service which informs air space users and air traffic control on those regions where contrails can form and persist and where other non-CO2 effects are large. This information is used in pre-tactical and tactical flight planning and optimisation and presented to air traffic controllers who finally have to guide the flights securely and efficiently.

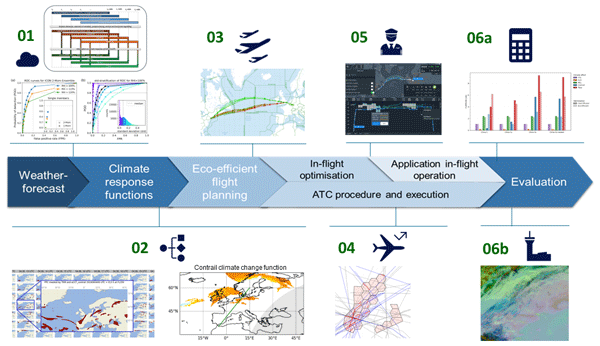
This integrated collaborative workflow can be illustrated to distinguish the tasks and challenges for future operational implementation of climate optimized trajectories (see Fig. 1). Various implementation options for alternative trajectories are represented, comprising pre-tactical eco-efficient flight planning, which incorporates all mitigation needs into an environmentally optimized flight plan. Another option is tactical in-flight optimisation and application in-flight operation in parallel to air traffic control (ATC) procedures and execution, where ANSPs (Air Navigation Service Providers) would take a role in directing the mitigation. The overall chain consists of providing weather forecast, together with climate response functions as climate forecast data and follow on with the respective planning and execution phases. The last step in this workflow in D-KULT is an intensive analysis and evaluation for validation purposes.
3.1 ICON model and WAWFOR data
In Germany, DWD (Germany's national meteorological service) provides aviation weather forecast with its World Aviation Weather Forecast (WAWFOR) dataset which is derived from numerical weather predictions based on the ICON (Icosahedral, non-hydrostatic) model (Zängl et al., 2015). WAWFOR is delivered globally with 0.25° × 0.25° (∼25 km × 25 km) horizontal grid size and especially for Europe and the eastern Atlantic from the ICON-EU Nest on a 0.0625° × 0.0625° (∼6.5 km × 6.5 km) grid. WAWFOR uses 57 vertical pressure levels, stemming from the 120 vertical model levels of ICON, interpolated to flight levels (FL in hft, about 30.5 m), from FL 50 to FL 600 in steps of 10 hft and additionally FL 675. WAWFOR consists of five data packages, from which package 1 contains for instance wind, temperature and humidity, that is, standard meteorological data. The other packages contain special data for significant weather like icing conditions, turbulence, etc. Such weather forecast data are used in the aviation flight routing software, for instance to avoid strong headwinds and to exploit strong tailwind (e.g. in the jet stream).
3.1.1 Formation and persistence of contrails
In order to avoid the formation of persistent contrails, it is necessary to reliably predict (1) the formation of contrails (short-lived and persistent ones) and (2) their longevity. The first task involves merely a simple thermodynamic criterion, the Schmidt-Appleman criterion (SAC, Schumann, 1996), which weather forecast models achieve with good success (Gierens et al., 2020). However, the prediction of ice supersaturation (ISS), remains challenging (Hofer et al., 2024). In this work two approaches with different level of complexity to predict ice supersaturated regions (ISSRs) are exploited.
Ice supersaturation means that the ambient relative humidity with respect to ice, RHi, exceeds 100 %. However, the operational version of ICON does hardly ever produce such high values of RHi, because of simplifications in the implemented one-moment cloud physics parameterisation (Gierens et al., 2022; Sperber and Gierens, 2023). In order to account for this deficiency, D-KULT's simple approach is to consider any situation where RHi exceeds a certain threshold as ISSR. In D-KULT, we chose a threshold of RHi=93 % (as in Hofer et al., 2024). Such a low threshold (instead of the physical one at 100 %) is intended to balance the low bias that the forecast model otherwise produces. The more sophisticated approach is to use an experimental version of ICON equipped with a two-moment cloud ice-microphysics scheme (adapted from Köhler and Seifert, 2015; Hanst et al., 2025) that does not consume ice supersaturation too quickly after cloud formation. Here, the threshold is set to its physical value of 100 %.
Note that the experimental forecasts using the two-moment scheme have no own initialisation (i.e., data assimilation cycle); they use the operational ICON initialisation, that is obtained with the one-moment scheme. As the latter has practically no supersaturation, it needs about 12 h of forecast lead time to build up such cases in the experimental forecasts, the so-called spin-up time. A further particularity is that the deterministic forecast of this experimental ICON version is taken as the mean over a ten-member ensemble, that is, there is no extra deterministic forecast from this system.
3.1.2 Contrail-related functions in D-KULT operational experimental weather forecast
To allow the formation of contrails, the temperature must be low enough to fulfil the SAC, which states that the evolving mixture of engine exhaust gases with ambient air must transiently become supersaturated with respect to the liquid phase, such that the emitted water vapour can condense on the co-emitted soot particles. The SAC depends on the type of fuel used and the overall propulsion efficiency of the aircraft. For the forecast of regions where contrails could form in D-KULT, we assume the general use of kerosene with an emission index of water vapour of 1.25 kg kg−1, a lower heating value of 43 MJ kg−1, and an overall propulsion efficiency of 0.365. This relatively high value has been determined as an average value by DFS for typical engine/aircraft combinations in their control space.
A significant contribution of D-KULT has been the implementation of the concept of “PPC areas” (Potential Persistent Contrail areas) in the operational weather forecast and WAWFOR. The term PPC combines SAC with ISS. If both conditions are met, PPC is set to one (or TRUE). Apart from the deterministic forecasts obtained from either the one- or the two-moment scheme, we use ensemble forecasts to assess the robustness of the PPC field. From these we obtain a field called PPCprob. PPCprob is the fraction of all ensemble forecast runs that show PPC = 1. For the operational ICON with its one-moment scheme there are 40 ensemble members, for the experimental ICON with the two-moment scheme there are 10.
For the guidance of avoidance experiments, we have introduced the so-called transmission probability TRM, which is a simple probabilistic estimate of whether a contrail can be seen from an earth-observation satellite (Gierens, 2023). An avoidance experiment should only be planned if there is a sufficiently high chance that the result of the experiment can be controlled by satellite observations. Appropriate situations imply a sufficiently large transmission probability (a practical threshold has not been determined yet).
3.1.3 Tests of contrail-forecast stability and uncertainty analysis
For the assessment of forecast stability instantaneous and temporal aspects were considered. For the instantaneous component of PPC forecasts, the agreement of ensemble members with the deterministic run is examined. On average an agreement of about 75 % between ensemble members and the deterministic run is found. Details are elaborated in von Bonhorst (2024). Now, further comparison of the ensemble forecasts (PPCprob) with the deterministic one (PPC) for each day in a complete year has been performed on a special statistic, namely the probability density of PPCprob under the condition PPC = 1. Time series of its low-degree moments (mean, median, standard deviation) have been analysed (von Koslowski and Gierens, 2026). They show clearly that there is a seasonal variation of the forecast skill, with higher skill in winter and lower skill in summer. The reasons for this can be found in the varying structure of the atmospheric dynamics: more frontal (i.e. large-scale) dynamics in winter vs. more convective (i.e. small-scale) dynamics in summer.
The temporal aspect of forecast stability evaluates the consistency of PPC forecasts for forecasts with different lead times towards a certain forecast time (target time). The results are categorized and expressed using the equitable threat score (ETS). The analysis shows a decline in forecast skill with increasing lead time, with ETS values decreasing from 0.7 for a 6 h lead time to 0.4 for lead times of 24–30 h (von Bonhorst et al., 2025). Notably, the forecast skill is insensitive to the choice of microphysics scheme (one-moment versus two-moment ice microphysics scheme), indicating that the primary source of uncertainty is the inherent nonlinear behaviour of the atmosphere rather than the choice of model configuration. Again, we can conclude that atmospheric dynamics is an important factor that modifies the forecast skill for predicting contrail-persistence on daily and seasonal time-scales. Consequently, forecast uncertainty can only be minimized by incorporating the most recent weather information, that ideally should be enhanced with assimilation of humidity data on cruise levels (e.g. from an extended AMDAR system).
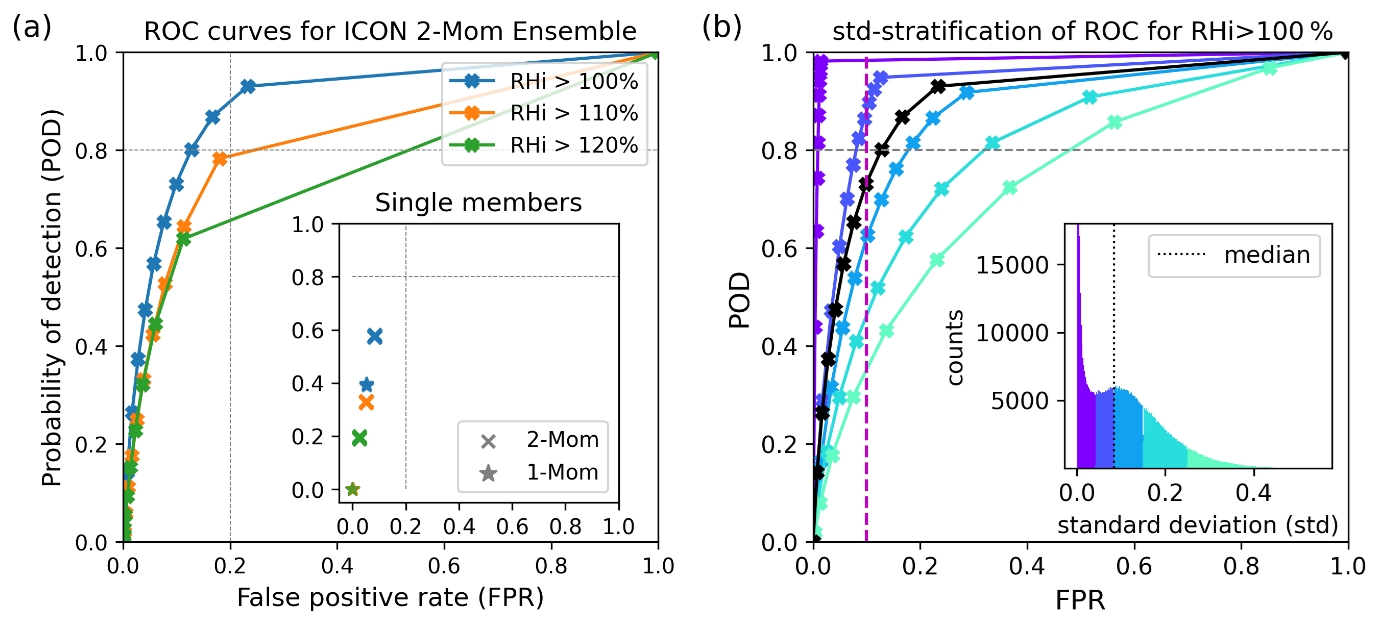
Figure 2Receiver Operating Characteristic (ROC) Analysis. (a) ROC curves for predicting ice supersaturation (blue) and higher supersaturation. The first non-trivial marker (top right) indicates the decision rule requiring at least one ensemble member to predict the condition; subsequent markers represent stricter criteria (e.g., ≥2 members, etc.). Each point shows the false positive rate (FPR) versus the probability of detection (POD). Verification is based on Vaisala RS41 radiosonde observations over 11.5 months (15 June 2024–31 May 2025) in the 8500–12500 gpm (geopotential metres) altitude range. Inset: FPR versus POD for each of the ten ensemble members (serving as approximations of the deterministic model), using the ICON model with both the operational one-moment and the experimental two-moment cloud ice microphysics schemes. (b) ROC curves for ice supersaturation, stratified by ensemble standard deviation (SD) of RHi. The black curve shows the unconditioned ROC curve as in (a) for comparison. The inset histogram illustrates the distribution of SD values and serves as a legend for the conditioned ROC curves. Verification period 14 months: 1 April 2024–31 May 2025; all other conditions as in (a).
The two-moment scheme was evaluated using 14 months of radiosonde data (see Fig. 2). Compared to the one-moment scheme an increased probability of detection (POD) for ice supersaturation was achieved (0.6 instead of 0.4), while maintaining a relatively low false positive rate (FPR) below 0.1. The PPCprob field has been used in combination with radiosonde data to check the probability of detection and the false alarm rates of contrail prediction with the ten-member ensemble of ICON with the two-moment scheme. This has been performed in the form a Receiver Operating Characteristic (ROC) analysis (see Fig. 2a). The analysis revealed that requiring at least three members to indicate ice supersaturation yields a strong predictor, with a substantially improved POD of 0.8 compared to the deterministic forecast, while maintaining a relatively low FPR of 0.13. Additionally using ensemble spread (standard deviation of RHi across the ensemble, Fig. 2b) for dynamic adjustment of the decision threshold allows to keep the FPR generally below 0.1. For more details and results on the ensemble analysis of the two-moment scheme see Hanst et al. (2025).
3.2 Climate response calculation for eco-efficient routing
3.2.1 Calculation of climate response estimates
Eco-efficient flight trajectory optimization, which integrates climate effects as an additional term in the optimization function (Matthes et al., 2012), relies on climate response functions, so called algorithmic climate change functions (aCCFs). ACCFs provide weather-dependent, spatially and temporally resolved estimates of climate response (in terms of a physical climate metric as, e.g., average temperature response ATR, see e.g. Megill et al., 2024) to individual aviation induced non-CO2 emissions. The concept of aCCFs emerged from Climate Change Functions (CCFs) (Grewe et al., 2014; Frömming et al., 2021) which were initially developed by means of Lagrangian tracking of aviation emissions within detailed climate–chemistry simulations. CCFs map the accumulated climate effect of an emission (during its lifetime or residence time) to the location (longitude, latitude, altitude) and time (date, hour) of the emission. Emission specific radiative forcing related to CCFs of NOx (O3, CH4) and H2O were found to be within the range of available modelling and observational data, while contrail optical depths and related RF underlying the contrail CCFs were found to be somewhat smaller (Grewe et al., 2014; Frömming et al., 2026). While CCFs are too computationally demanding for efficient use in operational flight planning, aCCFs offer a suitable alternative, though they involve significant simplifications. In effect, aCCFs were obtained via regression of CCFs onto local meteorological characteristics (e.g. temperature or geopotential) at the location and time of the emission (van Manen and Grewe, 2019). Thus, aCCFs are used to estimate CCFs (expectation values) as simple functions of local meteorological variables, and provide a rapid, operationally feasible method particularly suitable for real-time applications such as climate-optimized aircraft routing (Matthes et al., 2020; Lührs et al., 2018). Yin et al. (2023) presented the first consistent set of prototypic aCCFs for NOx-O3, NOx-CH4, H2O, CO2, and contrail cirrus effects (aCCF Version V1.0). The technical implementation of aCCF-V1.0 is provided in the open-source Python library CLIMaCCF V1.0 (Dietmüller et al., 2023). The aCCFs implemented in the D-KULT workflow were developed for summer and winter weather conditions (those for contrails only based on winter weather conditions) and have only been determined for the North-Atlantic flight corridor and small parts of Europe and North America (30–80° N, 0–75° W, 200 to 400 hPa). The application outside the original geographic and vertical scope and seasonal representation is subject of analysis but so far not recommended. In case of NOx aCCFs, values below 400 hPa should be replaced with the specific value of 400 hPa, otherwise unrealistic values would be accumulated on flight trajectories during climb and descent. A comparative study shows, that outside the design region aCCFs capture main magnitudes and gradients of CCFs but mostly underestimate their variability (Frömming et al., 2026). Contrail aCCFs were found to underestimate the climate impact due to a combination of effects.
ACCFs are computed in D-KULT directly from meteorological output quantities of the underlying ICON model by means of simple formulas as given in Dietmüller et al. (2023) and Yin et al. (2023) for an hourly resolution. They are provided through a series of experimental climate data sets compatible with the structure and design of WAWFOR, as schematically illustrated in Fig. A1. These data sets are denoted as Clima-X where X is a placeholder to distinguish between the different data sets (see Table A1). The 4-dimensional (latitude, longitude, altitude, time) response functions (aCCFs) and parameters for contrail prediction contained in the Clima-X data sets are listed in Table A2. The Clima-4s data set (see Table A1) is intended to serve as meteorological input data set for climate response models and can be used as input data for the weather-based approach of the Monitoring, Reporting and Verification (MRV) System. All variables are interpolated vertically from the height levels of the original NWP model to flight levels and horizontally from a triangular grid to a regular lat-lon grid.
ACCFs for NOx, water vapour and contrails are available in the experimental data set Clima-1 (deterministic run) and in Clima-1s (average of 10 experimental forecast ensemble members). Megill et al. (2024) identified the Average Temperature Response (ATR) and the Efficacy-weighted Global Warming Potential (EGWP) as the most suitable climate metrics for aircraft design and aviation policy and recommended a time horizon of at least 70 years to capture long-term climate impacts. While ATR involves more assumptions than GWP, it better reflects climate processes, is more intuitive for non-experts, and aligns directly with temperature-based climate goals such as the Paris Agreement (United Nations, 2015). Climate change functions in D-KULT use the climate metric F-ATR100 (the average temperature response over a time horizon of 100 years for a future scenario (F) according to business as usual as e.g. in Grewe et al., 2021). The formulation of the algorithms as used in D-KULT including metric conversion and other factors is given in Appendix B. These functions describe the climate response at a certain location and time for individual species in K per unit emission of NO2 (in case of aCCF-NOx) or in K per unit fuel consumed (in case of all other species). ACCFs of NOx are converted to climate response per fuel using aircraft specific emission indices and aircraft performance models in the flight planning process. The climate response can be converted to other climate metrics simply by conversion factors for the individual species (e.g. Dietmüller et al., 2023). By multiplying the climate change function at the respective location with the emitted quantity, the climate effect can be calculated. To estimate the climate effects of an aircraft trajectory the path integral along the flight path is typically represented by summing up the products of climate change functions and emissions over the individual flight segments, as has been introduced in Matthes et al. (2012).
In Clima-3s, the aCCF for contrails is replaced by contrail climate response calculated with the CoCiP model (Schumann, 2012). It is a fast parameterized Lagrangian plume model designed to simulate the formation, evolution and radiative effects of contrails and contrail cirrus (Schumann, 2012), and allows a large range of parameter settings on both technical aspects and atmospheric physics, e.g. time steps, humidity corrections, crystal shapes. CoCiP is a numerical tool and its output has been statistically analysed using satellite data from 230 individual flights (Schumann et al., 2017) and global traffic analyses (Schumann and Graf, 2013; Schumann et al., 2021; Vázquez-Navarro et al., 2015). In addition, lidar and in-situ observations were also used (e.g., Voigt et al., 2010, 2017, 2022; Märkl et al., 2024; Teoh et al., 2024). The latest version of CoCiP is available as open-source software in the Python package pycontrails (Shapiro et al., 2023). CoCiP provides detailed estimates of contrail microphysics, lifetime, geometry and radiative properties. It is applicable globally under both day and night conditions, with explicit criteria for determining contrail persistence based on lifetime. CoCiP defines persistent contrails via ice water content thresholds. Clima-3s utilizes the original Fortran version of CoCiP while Clima-4s is calculated with the pycontrails Python implementation (see details of history in Engberg et al., 2025). Designed for trajectory-based inputs, CoCiP has been adapted for grid-based operations to forecast regions where contrails form, enabling large-scale predictions of contrail cirrus effects (Engberg et al., 2025). More details on this tool can be found in Schumann (2012) and Engberg et al. (2025). Clima-3s uses the A350-900 as baseline aircraft for grid calculations. Standard CoCiP output in gridded mode is energy forcing per flight distance (EF given in J m−1) which is normalized to global mean radiative forcing by division with seconds per year and surface area of the Earth leading to W m−2 m−1. Radiative forcing per kg fuel is estimated by multiplying with the true airspeed and dividing by the fuel flow in the respective grid cell. True airspeed and fuel flow are determined by an aircraft performance model (Poll and Schumann, 2021) using temperature, pressure, and winds from ICON. Conversion factors from RF to F-ATR100 as given in Appendix B for aCCFs are applied analogously to CoCiP output.
ACCFs use a statistical regression-based framework to estimate average climate impacts under given atmospheric conditions (e.g. altitude, latitude, season). Because of the statistical approach aCCF values represent atmospheric variability, yielding levelled responses with smaller gradients. CoCiP employs a deterministic, physics-based numerical model to simulate contrail formation. It calculates a single air parcel trajectory based on high-resolution NWP data, ignoring atmospheric variability and forecast errors. Consequently, the results lack error bounds, which could lead to overconfident decision-making. These assumptions yield significantly steeper gradients in Clima-3s response fields. The discrepancies between the two methods arise from their fundamental frameworks, where statistical averaging reduces extremes compared to deterministic localised variability and peak responses, in addition to differing assumptions regarding contrail properties, geometry and lifetime.
Figure 3 shows climate responses from Clima-1 and Clima-1s for contrails, for NOx and for H2O and the contrail climate response from Clima-3s exemplarily for 18 July 2024 in terms of F-ATR100.
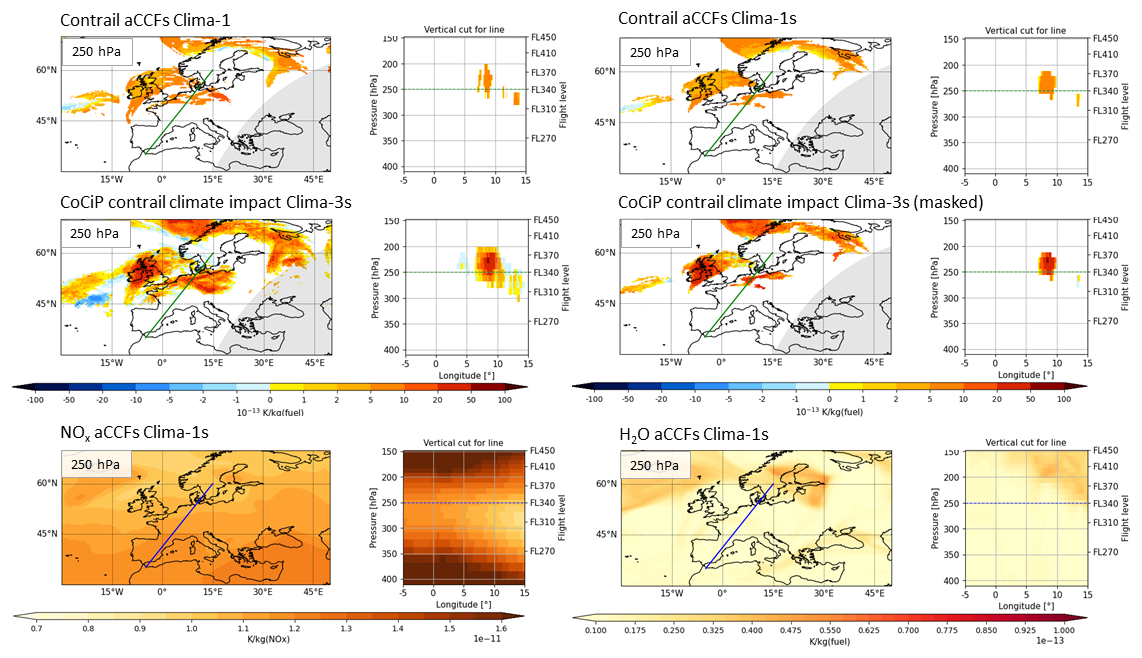
Figure 3Dataset comprising Clima-1, Clima-1s, Clima-3s and Clima-3s (masked by ensemble mean PPC) climate response functions for contrails, NOx and H2O in terms of F-ATR100 for 18 July 2024, 18:00 UTC, as derived from ICON operational and experimental simulation runs. The vertical cut represents a path from Malaga to Stockholm. The grey shaded areas in the top panels indicate local nighttime.
While aCCFs of NOx and H2O are nearly identical between the deterministic run and the ensemble experimental mean (not shown), contrail response functions show discrepancies between the various data sets. Differences between Clima-1 and Clima-1s are related to different ice microphysics in the deterministic and the experimental runs. Between Clima-1s and Clima-3s qualitative agreement is found in almost all areas, while the strength of the climate response can differ by up to a factor of 5 and in some areas differing signs can be observed. These differences are largely attributed to the different computation methods for contrail formation and their properties. Both methods include different underlying contrail properties (e.g. optical depths, particle shapes), contrail lifetimes, vertical and horizontal extent of contrails and different assumptions on radiative imbalance parameterisation. Further differences are caused by the sequence of calculation steps. In Clima-3s contrail climate responses were calculated individually for ensemble members leading to a larger spread in areas covered with contrails. For better comparison with Clima-1s, areas were masked with the ensemble mean PPC (see Fig. 3). Detailed comparisons between aCCF (contrail) and Pycontrails/CoCiP results are a research topic of the SESAR project CICONIA (Dietmüller et al., 2026).
3.2.2 Implementation of climate response functions for trajectory optimization
With the regular daily operational deployment of the novel Clima-X dataset, the full implementation chain for climate-optimized trajectory planning has been enabled. Within D-KULT, the successful setup, implementation, continuous generation, and provision of NOx-, H2O- and contrail climate response functions across various tools have been achieved, enabling complete execution of the eco-efficient trajectory planning workflow.
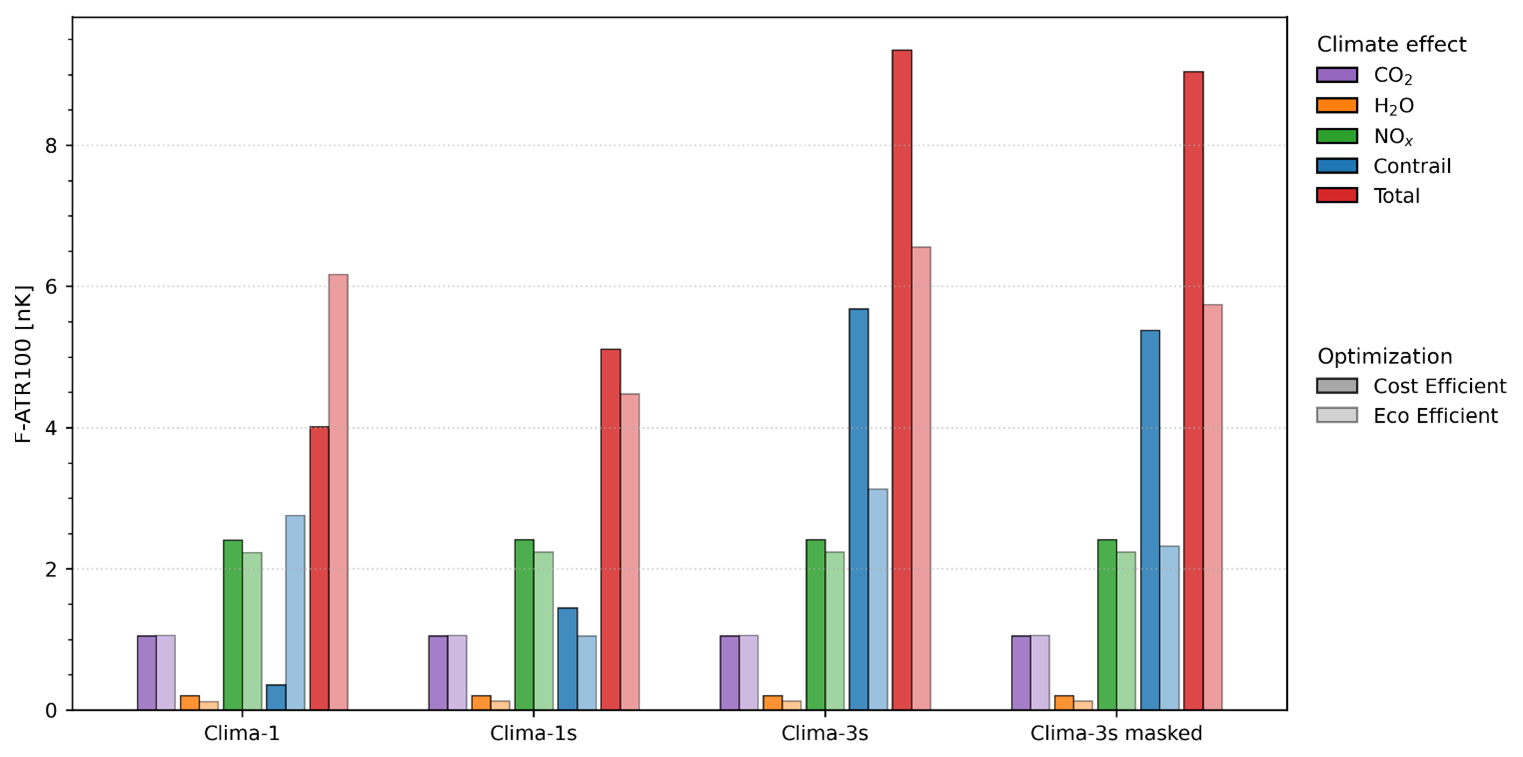
Figure 4Comparison of climate response for one exemplary flight in Europe for cost-efficient and eco-efficient flight trajectories using three meteorological datasets (Clima-1, Clima-1s, Clima-3s): CO2, H2O, NOx, contrail-induced radiative forcing, and total climate effect. Climate response is expressed as temperature change (F-ATR100) in units of 10−9 K.
Figure 4 shows the integrated climate response for cost-efficient and eco-efficient flight trajectories along one exemplary flight in Europe using different meteorological datasets (Clima-1, Clima-1s, Clima-3s). In all eco-efficient cases, the trajectory was optimized with respect to minimum contrail climate response using Clima-1s. The absolute CO2, H2O, and NOx climate responses give similar results for all datasets and routing variations, while the contrail-induced climate effects differ substantially between datasets and routing. In this example a higher contrail climate estimate results when optimized using Clima-1s but evaluated using Clima-1. When evaluated using Clima-3s, the absolute contrail response is 3–5 times that of Clima-1s and dominates the overall climate response. Differences between Clima-1 and Clima-1s are related to differences in microphysics and saturation thresholds, while differences between Clima-1s and Clima-3s are primarily caused by different methodologies and underlying contrail properties and secondary to different calculation sequence as outlined above. Overall, the results are highly sensitive to the underlying meteorological dataset and the chosen climate response model, as is the effectiveness of eco-efficient routing. A detailed analysis of such sensitivity is presented in Peter et al. (2026).
For the evaluation of trajectory performance, the climate effects are estimated by means of climate response tools that rely on a large set of input data and parameters which inherently contain uncertainties. As illustrated in Fig. 4, the influence of these uncertainties on the overall trajectory performance can be evaluated in a statistical workflow. The systematic integration of such uncertainties in the overall performance analysis is considered as a risk analysis, applying a Monte-Carlo analysis, where the respective parameters are varied within uncertainty ranges. As a result of such an analysis robustness of mitigation gains as well as corresponding confidence intervals can be estimated, allowing to estimate the probability of a desired outcome.
The optimization of flights targeting climate-friendly flight operations is subject not only to a wide range of target criteria but also to the requirements and boundary conditions of the various flight planning phases. In particular, the operational constraints of any airline (aircraft and crew rotation, scheduling adherence, etc.), but also the availability and quality of meteorological and climate data are relevant. In D-KULT, tools for trajectory optimization for pre-tactical (pre-flight) and tactical (in-flight) phases are being further developed to include climate data and impact mitigation criteria. These tools include Lido Flight 4D, FPO Cloud and pyTOM.
Lido Flight 4D is a software service to help airlines optimize flight trajectories. It is equipped with various cost factors that can play together based on the dispatcher's settings. This can be fuel and time costs as well as overflight charges implied by the ATC sectors. The Lido optimizer is using a graph-based optimization algorithm to solve the shortest-path problem between departure and destination. Additional rules published by EUROCONTROL and short notices like airspace closures must be respected. Eventually, flight safety relevant parts, such as extended twin engine operations (ETOPS), terrain clearance and emergency cases (engine out, depressurization) are all relevant during the optimization. Taking all those aspects into account, we can call such a flight plan “legal”.
To conduct vertical pre- or in-flight trajectory optimizations, PACE Flight Profile Optimizer (FPO Cloud) is using a legal flight plan, latest weather forecasts and mission parameters like fuel on board as input. The resulting vertical flight profile is optimized in terms of time- and fuel costs, if no other constraints like turbulence avoidance have been enabled.
DLR's Python-based Trajectory Optimization Module (pyTOM) is utilized to develop environmentally and climate-efficient flight trajectories with a continuous trajectory optimisation (Lührs et al., 2016; Lau et al., 2022). Initially, a feasible solution is generated, which is then refined through an optimal control algorithm to produce a dynamically consistent and optimal trajectory, incorporating a detailed aircraft performance model (using EUROCONTROL's Base of Aircraft Data (BADA) Revision 4.2, Nuic and Mouillet, 2012). Actual emissions are computed with the Boeing fuel flow method BFFM2 (DuBois and Paynter, 2006), which are then multiplied with the aCCFs (climate response per unit emission). The climate impact is represented as the time integral of aCCFs multiplied by the corresponding emission flow. The optimization considers both direct operating costs and climate effects, enabling the identification of flight trajectories that balance economic efficiency and climate protection. Although the resulting continuously optimized trajectories may not be directly operationally feasible, they provide valuable insights into the maximum achievable climate impact reduction and serve as a basis for developing practical eco-efficient flight procedures. PyTOM was successfully applied to a number of smaller scenarios and played a supporting role in the development and validation of the multi-criteria optimization capabilities of Lido Flight 4D.
During execution of flights, DFS, the German air navigation service provider, ensures safety in German airspace. It controls all aircraft flying under instrument flight rules (IFR) in Germany. DFS is a company organised under private law (GmbH) and wholly owned by the Federal Republic of Germany. Its task is to control air traffic in Germany in a safe, orderly and expeditious manner. This is what the German Aviation Act (LuftVG) in Article 27c (1) demands. Route optimization in cooperation with airspace users is a common task for an ANSP.
4.1 Single flight trajectory optimization for eco-efficient operations
4.1.1 Pre-tactical flight planning
Different approaches to trajectory optimisation are being pursued in the D-KULT project. On the one hand, legal eco-efficient trajectories are planned and calculated. On the other hand, approaches for continuous trajectory optimisation have been developed for the purpose of benchmark calculations.
For the planning of legal eco-efficient trajectories, the Lido optimizer was extended to take climate sensitive areas into account during the optimization. These areas are determined using the aCCFs from the Clima-X data sets. To include those climate sensitive regions (non-CO2 effects) in the optimization, their monetized climate effects are added as climate costs to the total cost function. In the mono-criterial optimization all those cost components need to be expressed in the same unit, a monetary value. As the non-CO2 climate effects are represented in Kelvin per unit emission or in K per unit fuel consumed, they needed to be converted first. This conversion factor is based on a CO2-price of USD 50 t−1 CO2, a uniform climate response per CO2 emission (K t−1 CO2) and the ratio of climate response of non-CO2 and CO2 contributions, as represented by the corresponding aCCFs.
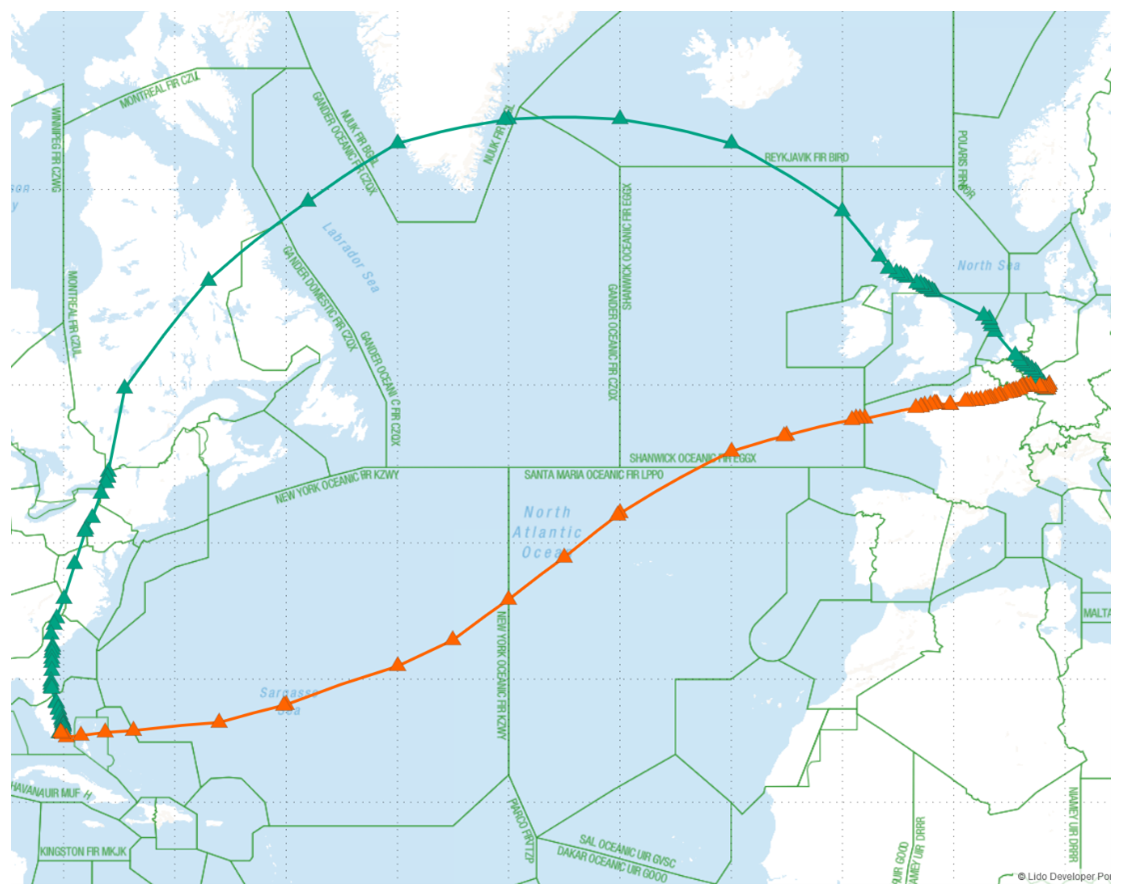
Figure 5Optimized aircraft routes with non-CO2 effects (green) and without non-CO2 effects (orange) within the airspace structure (triangles) © 2025 Lido Developer Portal.
Adding non-CO2-costs into the cost-function will not only have an effect locally to avoid certain regions but can result in completely different trajectories. As seen in Fig. 5, optimizing the flight Frankfurt to Miami based only on fuel and time costs, the trajectory (orange) crosses the North Atlantic. With non-CO2costs added, the optimizer chooses a route over the United Kingdom, Greenland and Canada to reach Miami (green).
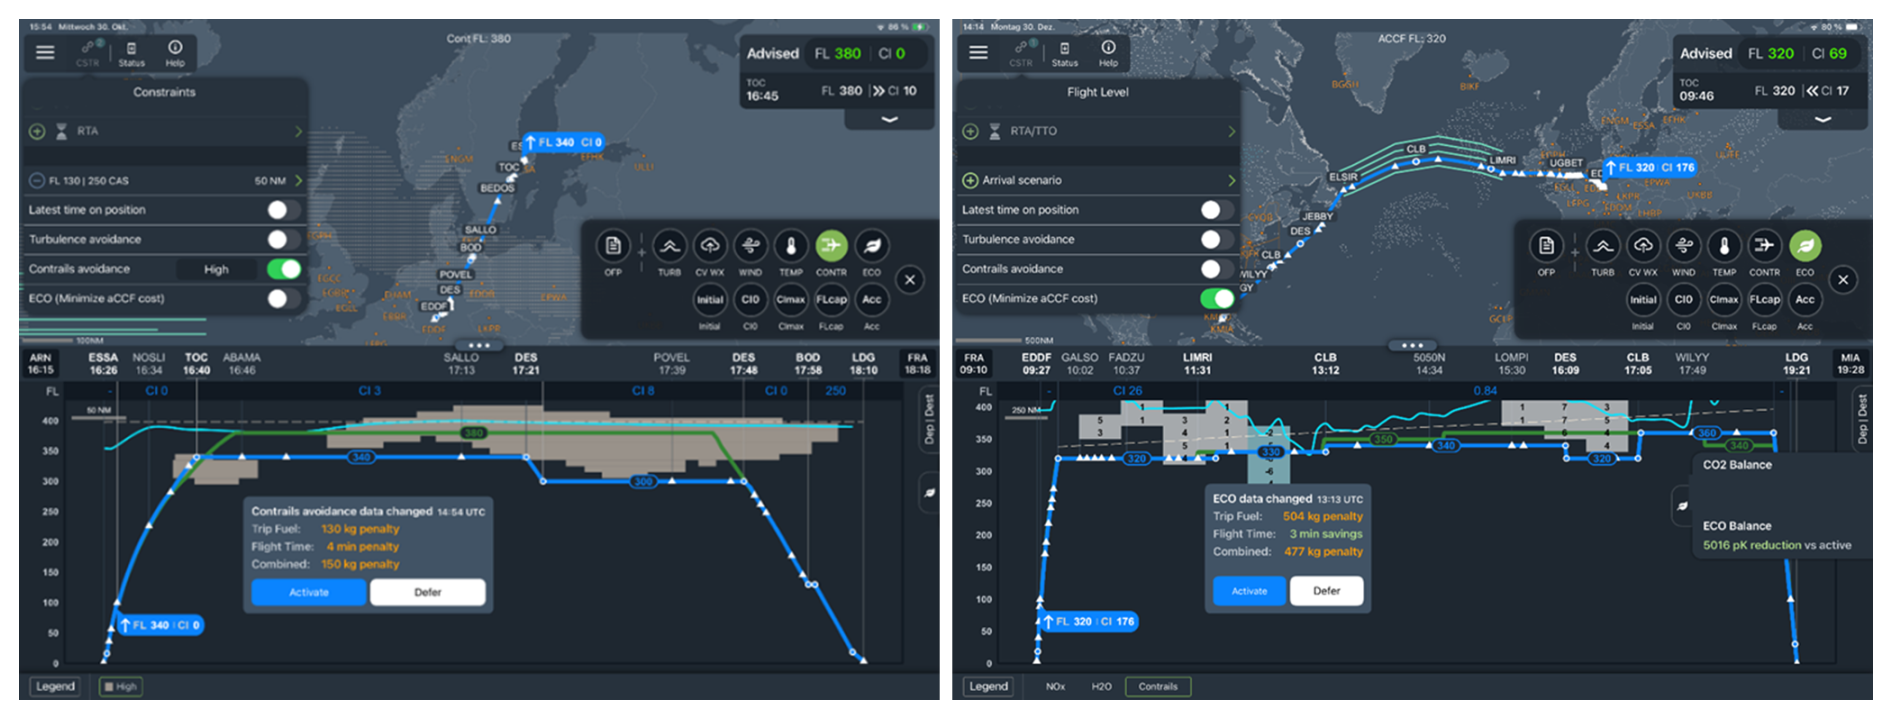
Figure 6Flight Planning System for in-flight trajectory optimization, Source: PACE – FPO Cloud (screenshots). Left: PPC-mode, right: ECO-mode. In PPC-mode, the optimizer minimizes the path length through PPC = 1 regions, in ECO mode it calculates a trajectory with minimum intersection with climate sensitive regions (as defined via aCCFs). The upper part of the screen shows a map with the flight path, the lower part displays the vertical view of the trajectory. The original trajectory is shown in green, the eco-efficient one in blue. Areas where PPC = 1 at the first cruise flight level (here FL 380) of the initial flight plan are indicated as grey dots. Insets show, how much extra fuel and time needs to be invested for the eco-efficient trajectory.
4.1.2 Tactical vertical flight routing
The Flight Profile Optimizer FPO Cloud by PACE is a tool that allows flight crews to upload the most recent weather information immediately before and during the flight and to compute an optimal vertical flight profile. In D-KULT, FPO Cloud has been enhanced by two new features for the calculation of climate efficient trajectories: one for PPC (PPC-mode), where the flight length through PPC = 1 areas will be minimized and one for aCCF (ECO-mode), calculating the expected total climate responses for CO2, NOx, H2O and contrails, to minimize the warming of the atmosphere. Figure 6 shows examples of a pre-flight calculation for these features. The maps view in PPC-mode (upper part) shows the lateral route and surrounding areas.. In addition, weather data at the actual time can be displayed. The profile view of PACE FPO Cloud (lower part) consists of flight plan information (times, way points, and Flight Levels) and weather data (PPC = 1) at respective local times of the flight plan. Both the initial active trajectory (time and fuel optimal, green) and the resulting trajectory of the contrail avoidance optimization (time and fuel and climate optimal, blue) are shown. Selection of the ECO-mode enables the pilot to select one of three aCCF parameters for visualisation. In the example (Fig. 6), the visualisation of aCCF Contrail is selected and the grey dots can be seen in the map- and in the profile view. The values in the blocks show the climate response functions of these areas. Depending on species, the potential climate response can be positive or negative (i.e. warming or cooling), which is indicated in the profile view as grey (positive response) or light blue (negative response) blocks.
Adding a climate relevant aspect to the optimization process will lead to an increase of time and/or fuel in many cases. An information pop-up is shown in the middle of the profile view, that informs the pilot about the consequences of following the new, climate optimised trajectory.
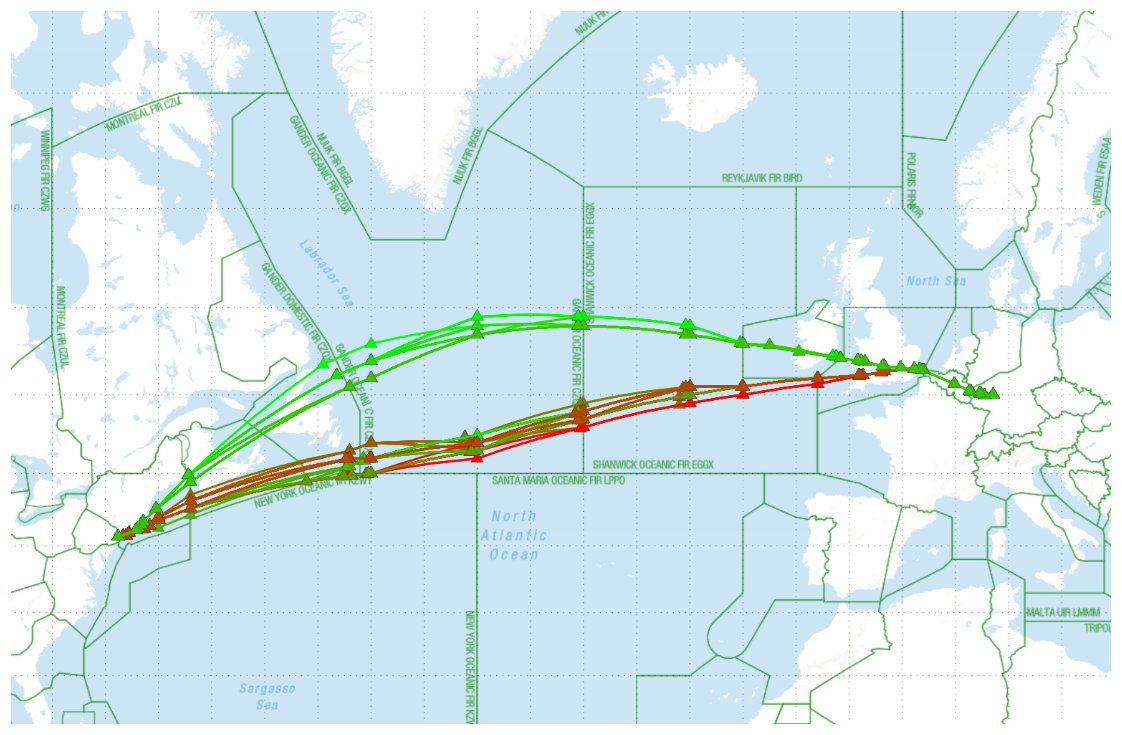
Figure 7Trajectories behind pareto-optimal solutions from Frankfurt to New York. Trajectories with relatively low climate cost are coloured in green, those with lower operational cost in red. © 2025 Lido Developer Portal.
4.2 Tests of the new features of the Lido and FPO tools (FPO cloud)
4.2.1 Tests of Lido: sensitivity of the solution to the weighting of climate vs. operational costs
Eco-efficient optimization includes the weighting of climate costs against operational costs. The resulting trajectory depends on the choice of these weights, and these are fixed in the enhanced Lido optimizer. The sensitivity of the solution to the choice of weights can be made visible using an additional bi-criterial extension of the Lido optimizer, which optimizes for operational and climate costs simultaneously. This implies that one cost component can only be lowered at the expense of increasing the other. Note that the bi-criterial extension is a research tool; it is not used in operations. In an operational-cost vs. climate cost diagram, the optimal solutions form the well-known Pareto-front where each point belongs to a different pair of weights. On a world map, each solution is represented as an individual flight trajectory (see Fig. 7). In the shown example green trajectories have relatively low climate cost, but higher operational cost and vice versa for the red ones.
4.2.2 Tests of Lido: pre-tactical flight planning
Tests of new prototype modules for flight planning software (Lido 4D) were executed during trial flights (called TF-100) conducted in the framework of a German initiative AkkL (Arbeitskreis klimafreundliche Luftfahrt, see AKKL, 2024). Key elements of the expanded D-KULT collaboration chain were added to the existing flight planning process, thus creating a new modified manual flight planning process that was applied during the experimental trial flights of TF-100. Once a flight was selected for rerouting, its original operational flight plan was taken out of the Lido automatic flight planning tool and the flights' trajectory was optimized by the Lido 4D extended prototype to calculate an eco-efficient routing, avoiding potential contrail areas where possible and feasible. This eco-efficient routing was precisely replicated using the standard Lido 4D planning system and the resulting flight plan was then submitted to the Network Manager for approval. The flight crew had been informed to strictly follow the given routing.
The eco-efficient routing was calculated based on Clima-1s datasets provided by DWD displaying warming contrail areas only masked by areas with natural cloud cover (TRM). To select the candidate flights, a graphical representation of the same datasets was used (with 7 flight levels from FL290 to FL410 in 1 h time steps), which dispatch experts could use to identify flights whose standard flight plan would have passed exactly through climate-sensitive areas (see Fig. 8).
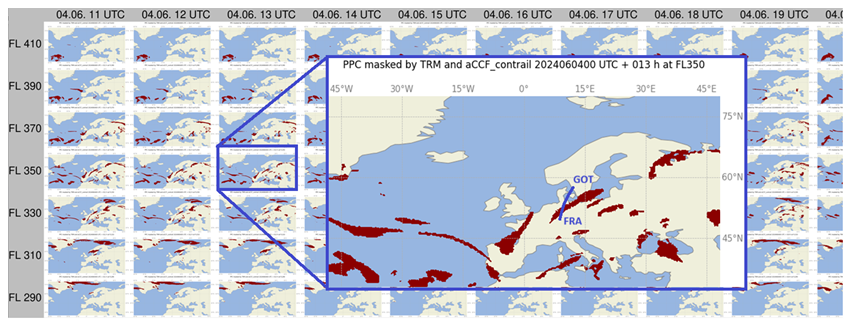
Figure 8Graphical representation of a Clima-1s dataset that was used to identify candidate flights; here a flight from Gothenburg (GOT) to Frankfurt (FRA) was chosen for contrail avoidance. Coastline data: Natural Earth; map generated using Cartopy and Matplotlib.
The evaluation of the estimated climate effect of the trial flights is ongoing and the results will be published elsewhere. The trial flights showed, that an implementation of climate-optimized trajectories could only be achieved by a workflow which relied on extensive manual interventions plus additional communication, e.g. with the pilots. For a possible future application in routine operations, automation of data flows and flight plan calculations is necessary, provided that weather and climate data are available in sufficient quality for the flight plan calculations. Further exploration needs to take place before active contrail avoidance could be implemented into the flight planning and filing process.
4.2.3 Tests of FPO Cloud on intercontinental flights
The new features of the FPO Cloud tool have been tested on several flights starting 1 May 2024 on the Lufthansa B747 fleet: by mid-2025, 9 flights were selected for active contrail avoidance with tactical optimization and on 16 flights, the tool was used in shadow mode without active avoidance during flight execution for contrail monitoring.
The workflow remained a very manual process as the prototype tool was only available on a prototype device that could not be taken onboard the actual aircraft. The flight crew thus had to request an optimization during their flight preparation (approximately 2 h prior take off). PACE could then calculate the optimized trajectory on the prototype device and send screenshots of the resulting optimizations to the flight crew via email. Such screenshots are presented in Fig. 6. In FPO Cloud, the crew uses the information presented in the lower part of the screen to “Activate” or “Defer” the eco-efficient trajectory. Once on board, the flight crew used the PACE FPO classic tool to execute a routine flight optimization and compare that data with the screenshots of the FPO cloud prototype. Then, the decision whether it was feasible and/or possible to circumnavigate the PPC/aCCF contrail areas or not could be made and the flight's vertical trajectory could be altered accordingly. Occasional circumstances can inhibit the tactical contrail avoidance, e.g. unavailable cruise levels due to surrounding air traffic, turbulence and convective weather, and prolonged flight times with significant additional fuel burn and emissions for the avoidance trajectories.
Although a quantitative evaluation of the flight tests seems desirable, we cannot offer it here since the number of trial flights was too small to reach scientifically and statistically robust results. Simulation studies showed that the effectiveness strongly depends on the meteorological situation and forecast quality: for example, the case shown in Fig. 6 forecasted an almost complete cruise contrail avoidance with a fuel penalty of about 130 kg, approximately 4 min additional flight time, and a reduction of the temperature change metric by 5015 pK. However, other situations would have required trajectory deviations that lead to operational and economical challenges that could have resulted in unacceptable magnitudes in additional time and fuel as well as unacceptable slot delays and capacity restrictions. Consequently, the presented results should mainly be interpreted as a conceptual and operational proof-of-feasibility, rather than an evaluation of the climate response estimates. Further exploration and testing need to be done in order to confirm the correct optimization and to further automate the process.
4.3 Real-time simulation for tactical contrail avoidance
DFS developed a visualization tool (PPC tool) that can graphically process the forecast data of the DWD for different times and altitudes, as well as Clima-X data. The tactical avoidance areas are represented on the controller's radar screen as hexagons in a way that does not conflict with other area representations. A hexagon is marked as active if at least half of its area is covered with PPC = 1 at the respective flight level. All active hexagons extend vertically between two flight levels and are combined to a three-dimensional structure. With this approach, DFS became one of the first organizations worldwide to integrate PPC areas into the main traffic window of its Air Traffic Control System for validation purposes. A final representation version will be customized, as the development and definition of an optimal display remain important next steps for the practical implementation of the procedure to avoid persistent contrails.
For the tactical avoidance of persistent contrails, air traffic control needs operational concepts that can be tested in operational trials. To develop and define such concepts, a real-time simulation (RTS) was conducted in the fourth quarter of 2023. The goal was to examine the avoidance of PPC = 1 regions in terms of operational procedures and to assess their impact on, for instance, airspace capacity. A key advantage of a simulator campaign is the assessment of practicality of operational procedures and of the representation of climate sensitive areas on the controller's radar screen in a safe environment. The RTS was performed with various loads of real recorded traffic in day and night configuration at KASIM (the simulator of the Karlsruhe Centre branch with the operational ATC system) and focused on a section of the EBG Ost (Operational Authorization Group East). Several PPC = 1 regions have been transferred into the ATC-System environment and shown on the radar screens in two general versions, namely static (selected PPC = 1 regions do not change throughout the simulation run) and dynamic (PPC = 1 regions move according to the weather forecast). Each simulation day included 3–6 simulation runs with 10 participants (controllers), who changed their positions between runs to introduce variation. Briefing materials for controllers have been prepared, as well as questionnaires and debriefing questionnaires before, during and after each simulation run. These were used to assess workload and situational awareness, as well as to collect general feedback on the simulation.
The operational procedure determined that PPC = 1 regions should be avoided laterally and vertically. The assumed reference value for level change of 2000 ft could not be maintained as the areas had an average thickness of 4000 ft. This large vertical extent was statistically examined by DFS based on Clima-1 data of year 2023 over the region EBG Ost. However, we stress that the actual vertical dimension of ISSRs or PPC = 1 regions can only be obtained by measurements. Increasing dimension of PPC-areas have significant influence on reduction of airspace capacity. The coordination with adjacent areas had to be considered to reduce the workload in the affected sector. Any aircraft had to remain within their designated airspace. Deviating into the underlying facility was not intended.
The newly developed operational procedure turned out basically usable. Thus, a necessary step has been achieved before such a procedure can be used operationally. However, significant additional workload for the air traffic controllers arose in the simulation (as reported in the questionnaires), which resulted in capacity restrictions. These were related to the reduction of available airspace, as flight levels and areas were kept clear of aircraft. This is no surprise for conducting such a trial based on real traffic in one of the world's most densely flown airspaces, but even when the traffic load was reduced, additional workload due to the new procedure was still recorded. Hence, not all flights could be rerouted around the PPC areas. During the five simulation days, well-founded statements on the feasibility of PPC avoidance could be made, and the planned simulation goals were achieved.
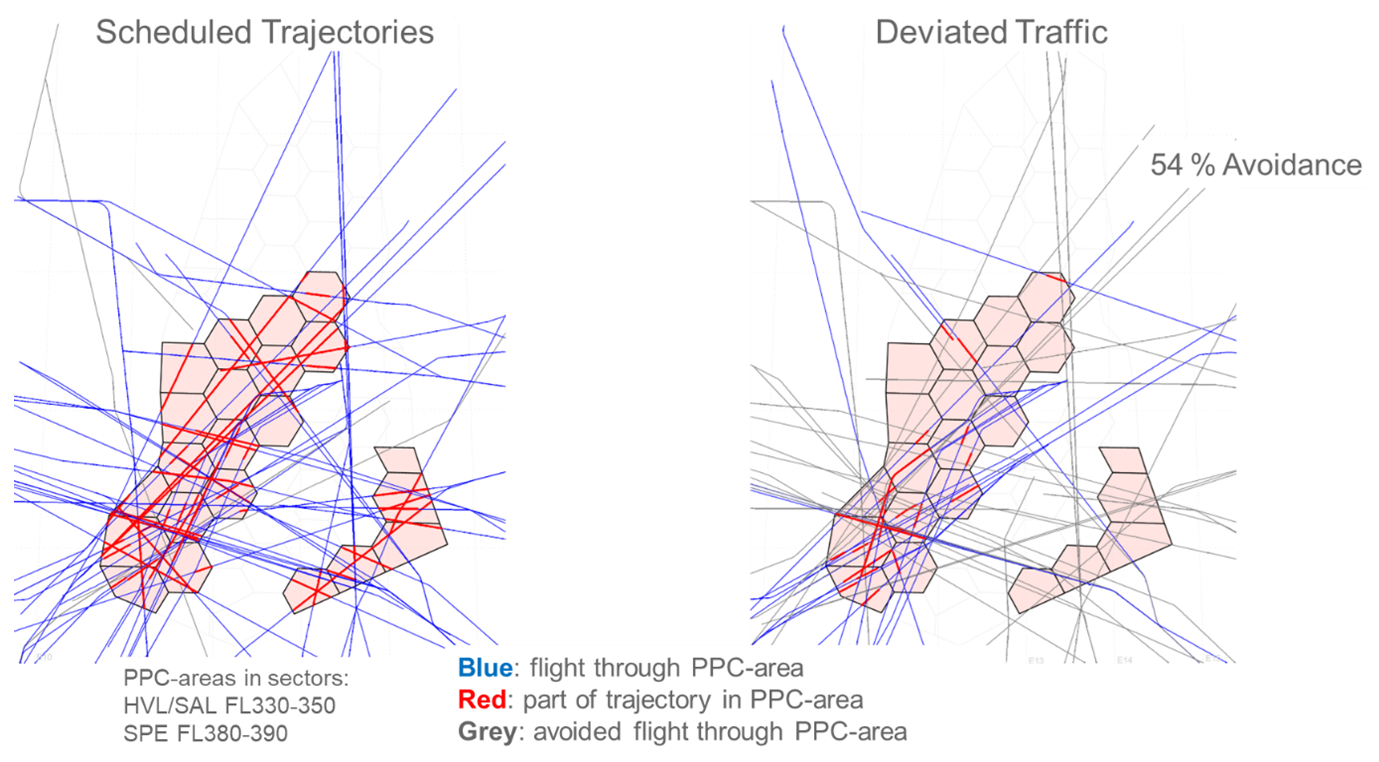
Figure 9Comparison of planned traffic with controlled traffic to avoid the PPC-areas. PPC areas are found in the sectors HVL/SAL (Havel and Saale) in flight levels 330–350 and in sector SPE (Spree) in flight levels 380–390. Blue traces represent planned flight trajectories; the portion passing through a PPC area is marked in red. Grey trajectories were successfully rerouted above or below the PPC area. On the left, the intended planned flight paths are shown, and on the right, the result of the avoidance manoeuvre is displayed. However, several challenges and safety-related issues were identified that still need to be resolved. Three of them were due to display-related issues, and one was due to a system issue. As an example of a display-related issue, an overlap of the aircraft identification with the PPC honeycombs was observed, which rendered the identification unreadable. Such a label overlap is essentially uncritical in a simulation environment; however, it must never occur during actual operations. These issues will be re-evaluated in a safety assessment of the operational procedure.
Figure 9 shows an example of the rerouted traffic in the simulation. In this example, only 54 % of the aircraft planned to cross the PPC area were kept out of the PPC area. In the simulation, day scenarios showed a range of 54 %–91 %, while night scenarios ranged from 67 %–100 %. Due to the various variables included in the simulation, these values should be interpreted as indicative only, demonstrating that the effectiveness of avoidance strongly depends on surrounding conditions such as the size and location of PPC areas as well as traffic density. According to a recent study, such a medium fraction of contrail avoidance in a region implies that only a smaller fraction (smaller than 54 %, depending on meteorological circumstances) of the maximum possible climate benefit (achievable by keeping all aircraft out of the PPC area) would be achieved (Gierens, 2025).
The RTS flights and contrail-avoidance reroutings have additionally been analysed regarding their mitigation of climate impact. For this, it was necessary to consider the complete flights and their parameters (e.g. aircraft mass, fuel flow, etc.) from start to landing, not only the part of the flight in the EGB Ost. For this purpose, the Trajectory Calculation Module (TCM, Linke, 2016) was used and the corresponding emission quantities were estimated using correlation methods (BFFM2 (Boeing Fuel Flow Method), DuBois and Paynter, 2006; see also Zengerling et al., 2022). TCM uses ECMWF-ERA5 (European Centre for Medium-Range Weather Forecasts – ReAnalysis 5) instead of ICON and thus the aCCFs have been determined with ERA5 fields for this application. The estimated climate effect reductions in the F-ATR100 metric are shown in Fig. 10, comparing the climate effects from emissions of the reference (no reroutings) and the contrail-avoidance scenario. All species were considered, and for reasons of simplification, NOx aCCFs were set to zero for altitudes below the pressure level of 400 hPa. It should also be noted that a detailed investigation revealed significant discrepancies in the representation of PPC areas between the DWD ICON-EU and ECMWF ERA5 models (Peter et al., 2026), likely driven by differences in model physics, input data (e.g., humidity), and calculation approaches (DFS PPC tool vs. aCCF-model). Estimates in Fig. 10 show that the PPC avoidance scenario yields a reduction of CiC climate response in terms of F-ATR100 (by almost 18 % compared with the component response in the reference scenario), which is, however, overcompensated in the total climate response due to increases of the NOx and CO2 contributions. Overall, the PPC avoidance scenario yields in this case an increase of total climate response of about 2 %.
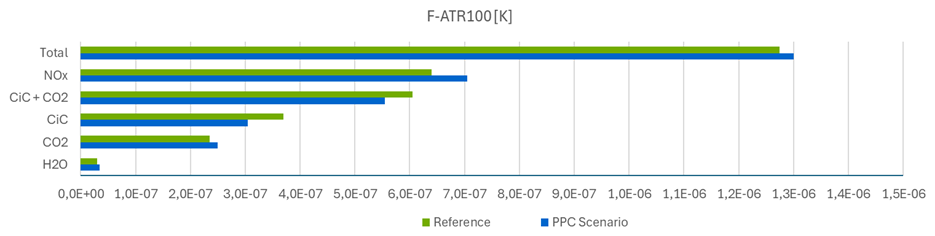
Figure 10Comparison of the estimates of the reference and PPC scenario in terms of the climate metric F-ATR100. The prevailing uncertainties in these quantitative estimates could not be determined within the scope of this study.
This demonstrates that the inclusion of all component effects of air traffic should be considered for rerouting planning and decisions. Compensating component effects (trade-offs) as well as the influence of short- and long-term climate metrics determine the overall result.
5.1 Contrail detection with satellite data
In principle contrails can be detected with ground-based instruments – cameras exploiting visible and/or thermal radiation. However, only satellites offer a global coverage and an unhindered view, independently of low-level clouds and illumination conditions, on contrails, which are formed in the upper troposphere and lower stratosphere (UTLS). However, for the validation of contrail avoidance, it is not ideal to rely on polar orbiting satellites because they cannot provide a continuous view on the airspace. In contrast, geostationary platforms have a very large field of view and high repetition rates such that entire flight paths flown at any time of the day and the night can be investigated to identify contrails in their vicinity and are expected to prove whether an avoidance or an observation flight (one without avoidance to control the contrail prediction) was successful. Until December 2024, Meteosat Second Generation (MSG) was the operational geostationary satellite for the European and African continent that could be used to perform this task. It carries the SEVIRI instrument (Spinning Enhanced Visible Infra-Red Imager, Schmetz et al., 2002): an imaging radiometer with four channels in the solar and eight channels in the thermal range. Apart from the high-resolution visible channel (HRV) with a nadir sampling distance of 1 km, all other spectral bands have a spatial resolution of 3 km at nadir. For the operational service, MSG/SEVIRI acquires an image of the full Earth disk every 15 min, in rapid scan mode it scans Europe and North Africa every 5 min.
Automatic contrail detection has been originally developed for the AVHHR (Advanced Very High-Resolution Radiometer) sensor aboard the polar-orbiting NOAA (National Oceanic and Atmospheric Administration) satellites with a better spatial resolution (around 1 km at nadir) by means of image processing techniques by Mannstein et al. (1999) exploiting brightness temperatures and brightness temperature differences. This algorithm has been applied to other polar orbiting sensors like MODIS (Moderate Resolution Imaging Spectroradiometer, Duda et al., 2013), and also to MSG/SEVIRI (Mannstein et al., 2010; Dekoutsidis et al., 2023). In particular, for MSG/SEVIRI the channels centred at 8.7 and 12.0 µm were used in Mannstein et al. (2010), while Dekoutsidis et al. (2023) tested the usage of the water vapour channel centred at 7.3 µm. Unfortunately, due to its relatively coarse spatial resolution, MSG/SEVIRI is prone to relatively high false alarm rates (0.7–0.9) and low detection efficiencies (probability of detection 0.2–0.4), where higher false alarm rates are connected with higher probability of detection, and a contrail is expected to appear in a satellite image at least 30 but more probably 60 min after an individual flight has passed through the pixel (Duda et al., 2004; Vázquez-Navarro et al., 2015; Gierens and Vázquez-Navarro, 2018). For the current generation of American geostationary satellites GOES-R/S/T machine learning has been applied to contrail detection with good success (Zhang et al., 2018; Kulik, 2019; Meijer et al., 2022; Chevallier et al., 2023; Ng et al., 2024) by means of convolutional neural networks. However, the ABI instrument carried on these satellites has a better spatial resolution of 2 km at nadir for thermal channels and, of course, slightly different spectral channels such that these algorithms cannot be directly applied to MSG/SEVIRI.
5.2 Methods for the validation of contrail avoidance
The goal of this work is to improve the Mannstein et al. (1999) method for contrail detection that had been implemented for Low Earth Orbit satellites and directly translated to the geostationary MSG (see Sect. 2.5). We adapt the overall Mannstein strategy for contrail detection to increase, in particular, the probability of detection (see Sect. 4.5) when using MSG/SEVIRI. This is a central task when one wants to evaluate contrail avoidance. The advantage of this traditional image processing technique is, that it is easily extendable to other satellite sensors and/or channels, as the application of the Mannstein CDA to MSG/SEVIRI shows (Mannstein et al., 2010; Dekoutsidis et al., 2023), although it was originally developed for AVHRR. The disadvantages are, that it does not exploit more modern techniques for image processing or machine learning. The contrail detection algorithm (CDA) by Mannstein et al. (1999), exploits the fact that contrails appear as cold/dark lines in brightness temperatures BT(12.0) in the channel centred at 12.0 µm due to their location in the upper troposphere and show high brightness temperature differences BTD(10.8–12.0) between 10.8 and 12.0 µm because of their low optical thickness and small ice crystal effective radii. The steps that eventually lead to the desired contrail mask are described in the paper by Mannstein et al. (1999) in detail. For MSG/SEVIRI we proceed as follows. SEVIRI has eight spectral channels in the thermal infrared instead of two of the NOAA/AVHRR sensor. Thus, to enhance the capabilities to identify contrails with MSG/SEVIRI data the procedure described by Mannstein et al. (1999) is applied twice to BT(12.0) and BTD(10.8–12.0) on one hand and BT(12.0) and BTD(8.7–12.0) on the other hand.
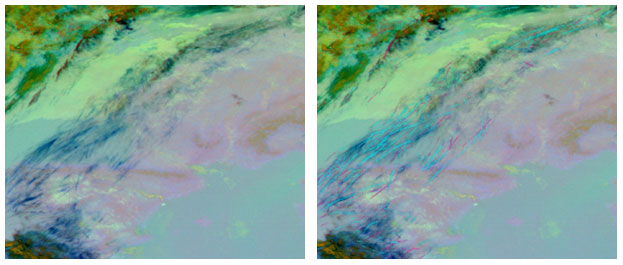
Figure 11MSG/SEVIRI observation over Spain and France on 16 February 2019 at 10:00 UTC. Left: Ash RGB highlighting contrails as dark blue lines. Right: Contrails detected by contrail detection algorithms (CDA). Cyan pixels indicate those contrails detected by the CDA using BTD(10.8–12.0) and BTD(8.7–12.0) separately, while the pink pixels indicate the contrails additionally detected by the improved CDA version presented here.
In addition, for every channel combination the use of the 19×19 pixels large line filter is complemented by an additional 17×17 pixels large line filter that aims at detecting thinner and/or fainter contrails. Finally, these filters are applied to 32 different directions in order to allow for a better coverage of all possible orientations. The final contrail mask consists of the union of the contrails resulting from all the channel and filter combinations. An example is shown in Fig. 11 for a situation with many contrails over Spain and France at 10:00 UTC on 16 February 2019. In the right panel, pixels are marked in cyan that are detected by the former versions of the CDA for MSG, while the pink pixels represent the additional contrails detected by the current version.
The improved CDA is used to identify contrails in quicklooks after contrail-avoidance experiments and for an initial visual evaluation of the contrails in regions where D-KULT flights of the TF-100 have taken place. For a quantitative evaluation of the success of the avoidance and observation flights a technique (described elsewhere) has been developed that is based on contrail detection but additionally exploits properties of the single contrails and their temporal evolution to associate observed contrails to the flight under consideration.
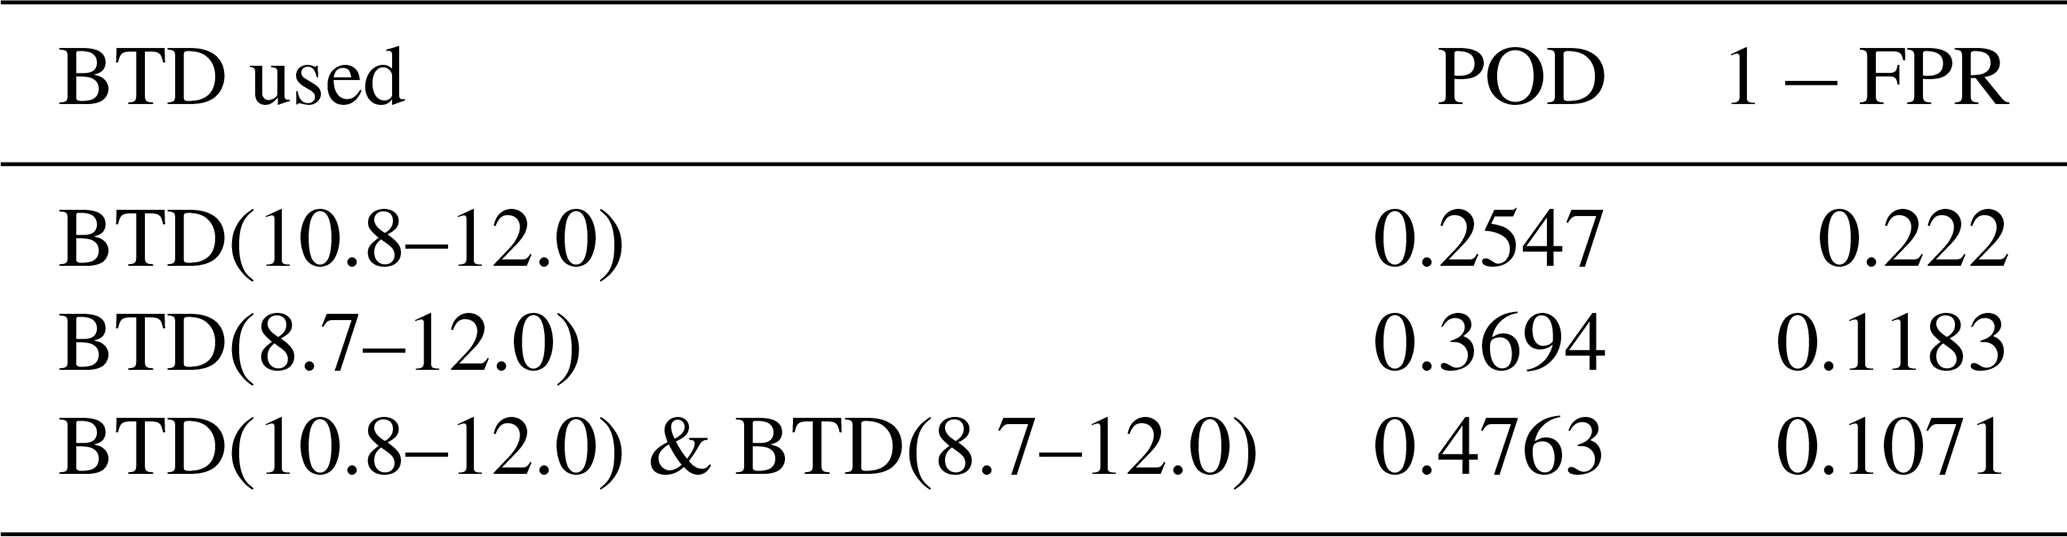
Table 1Probability of detection (POD, also called rcall) and precision (1 − FPR; FPR: false positive rate) for the three contrail detection algorithm versions mentioned in the text.
5.3 Tests of the improved contrail detection algorithm
The contrail detection algorithm (CDA) with various channel combinations has been evaluated against a set of 89 images of 256×256 pixel size with different numbers of contrails (Santos Gabriel et al., 2026a). All images have been manually labelled and serve as a reference for the determination of probability of detection (POD, recall) and precision (see Table 1). In general, for MSG/SEVIRI, recall and precision are relatively low. The original BTD(10.8–12.0) version shows the lowest recall but the highest precision, i.e. the lowest false alarm rate (FAR). The CDA with the second BTD combination – BTD(8.7–12.0) – has a large recall but an even lower precision. The current version of the CDA described in Sect. 5.2 that uses a pair of BTDs has the largest recall but also a low precision similar to BTD(8.7–12.0). The comparison of the performance of the improved CDA for MSG compared to the AI-based methods mentioned in Sect. 5.1 is challenging due to differences in sensor characteristics, spatial resolution, observational domain and time, input data, and evaluation criteria. Meijer et al. (2022) report a recall of 50.2 % and a precision of 52.5 %, while Ng et al. (2024) obtain a precision of 80 % for a 50 % recall. These precision values are (substantially) higher than ours with a similar recall, thus suggesting that AI-based algorithms for the current generation of geostationary satellites of the GOES-R series generally achieve higher skill. However, this may result not only from differences in methods, but also from differences in data, meteorological conditions and/or evaluation approaches.
In summary, since we think that a higher POD is essential for contrail detection in contrail avoidance experiments, the current version of the CDA is most suitable for this task, but particular care has to be taken since the high FAR is of course detrimental to the evaluation.
6.1 Overall progress toward eco-efficient flying
This concept paper presents an integrated collaboration workflow for climate-optimized flight planning which combines numerical weather prediction with climate response modelling, in order to inform the trajectory optimization process. The subsequent steps in the workflow comprise planning of eco-efficient trajectories which are made available to dispatch, completed by pre-flight and in-flight optimization, which can then be applied in operations and modified ATC procedures. Modifications of the individual components as investigated by D-KULT are described systematically, subsequently demonstrating advancement and connection to state-of-the-art methodologies, available data products and existing interfaces that have been established.
Specifically, D-KULT has implemented enhancements across individual components to advance the path towards operational eco-efficient flying:
-
The German Weather Service (DWD) provides data on climate sensitive regions, using the output of regular weather forecasts to compute algorithmic climate change functions and predict the formation of persistent contrails.
-
LH Systems and PACE extended their flight planning and optimization software to incorporate information on regions that are labelled as climate-sensitive, enabling the computation of eco-efficient trajectories.
-
DFS developed initial methods and ideas to visualize climate sensitive regions on air traffic control radar screens for simulation purposes.
-
The legacy contrail detection algorithm has been extended to process geostationary satellite data, enabling the evaluation of contrail avoidance experiments.
-
D-KULT has established an operational implementation of eco-efficient flights into real-flight operations in an interdisciplinary collaboration involving all key stakeholders across the decision-making chain relying on numerical response tools. For the first time, the complete information chain has been established and successfully tested in operational flight trials.
Despite this significant progress, the technical realisation and the underlying scientific foundation are yet not mature or robust yet, requiring further adjustments. Several key lessons emerged during the project. In the following section, we describe recommendations and remaining challenges (along the information chain) that still need to be solved before eco-efficient flight trajectories can be considered as a mature approach for real operation of flight planning and execution.
The feasibility demonstrated in D-KULT should therefore be interpreted as operational feasibility of the integrated information chain, associated procedures and decision-making workflow. The project demonstrates that climate-response estimates from numerical models can be incorporated into operational flight planning and air traffic management processes. It does not, however, provide a validation of the quantitative accuracy of these climate-response estimates, which depends on the underlying numerical models and is outside the scope of the present work.
6.2 Meteorological data and predictability
Cirrus, contrails, upper-tropospheric humidity, and ice supersaturation were never in the focus of numerical weather prediction models. Improvement brings the foreseen operational introduction of the 2-moment cloud microphysics ICON scheme at DWD, which was initiated and tested as an experimental feature in D-KULT. Additional aircraft humidity sensors measuring at flight levels and used for assimilation are also expected to improve humidity forecasts (outside the scope of D-KULT). The usage of ensemble prediction systems can increase the forecast skill of PPC regions. And the predicted spread of the ensemble provides a predictability estimate and allows a quantification of uncertainty of the PPC prediction (see Fig. 2b and Hanst et al., 2025).
6.3 Uncertainties in climate response modelling (aCCFs, CoCiP, pycontrails)
As the formulation of aCCFs provides expectation values of climate response, residual uncertainties are inevitable, which is a necessary cost for a computational efficient and practical tool. Currently, aCCFs exist only in a version developed with training data limited to certain weather conditions, geographic scope and altitude range. Guidance on applying aCCFs beyond their scope of validity (although not recommended) can be found in Dietmüller et al. (2023). To extend their application across different regions and seasons requires new calculations of CCFs with climate-chemistry models. The uncertainties of contrails response estimates arise from differences in the meteorological input data from different atmospheric models (Peter et al., 2025), from the calculation of aircraft emissions, as well as model parameterisations and statistical methods. Further, assumptions on background conditions and contrail properties (e.g. contrail lifetimes, ice crystal shape, radiative properties) and the algorithms themselves (residuals) cause uncertainties. Despite the uncertainties, the viability of O3-aCCFs in reducing ozone climate response was demonstrated in comparison to detailed atmospheric chemistry-climate model simulations (Yin et al., 2023). Furthermore, a general agreement of absolute quantities and gradients of climate responses, but reduced variance of aCCFs compared to detailed chemistry-climate model simulations was found (Frömming et al., 2026).
CoCiP and pycontrails apply a deterministic, physically based modelling approach to simulate contrail formation and evolution along one Lagrangian trajectory. However, as a numerical tool they also rely on simplifying assumptions (Schumann, 2012; Engberg et al., 2025; Akhtar Martínez et al., 2025) and their parametric instantaneous radiative forcing calculation are based on regression (Schumann et al., 2012), thus yielding expectation values.
6.4 Sensitivity of climate benefits and trade-offs
The consideration of opposing climate effects was partially addressed in simulations in the study by Teoh et al. (2020), as well as in Borella et al. (2024), and Dahlmann et al. (2026). In our analysis climate effects are not compared using radiative forcing values, instead we focus on the average temperature response consistent with the sensitivity study (Matthes et al., 2020) that applies a set of various physical climate metrics. The combined effects (contrails and CO2) in the exemplary estimation (Fig. 10) yield a reduction of climate response in terms of F-ATR100, which is overcompensated by counteracting effects (CO2, H2O, and NOx) resulting in overall climate warming. For shorter time horizons (e.g. 20 years, not shown) short-term effects (e.g. contrails, NOx) would gain importance over long term effects (CO2). Since uncertainties (comprising e.g. the choice of physical climate metric and time horizon) were not assessed, the associated error margin might cross the zero line, making even the sign of overall climate impact uncertain. Matthes et al. (2020) suggested to explore robustness of mitigation gains incorporating uncertainties from various sources (metric, NWP, response model, etc.). Future evaluations should therefore conduct a comprehensive uncertainty analysis and further refine the evaluation framework to assess robustness and reliability of results.
6.5 Satellite-based contrail detection
For the evaluation of the contrail avoidance flights dedicated tools are necessary to bridge the time between contrail formation and contrail appearance in the satellite image. High detection efficiencies and low false alarms are needed for this task which remains challenging, due to the moderate resolution of the Meteosat Second Generation satellite instruments. An evident improvement is provided by the newly launched Meteosat Third Generation.
6.6 Air traffic controller workload, safety and air space capacity
Real-time simulations on tactical contrail avoidance revealed that controller workload increases significantly, which is related to grave flight capacity reduction. In combination with the identified safety-relevant issues, key prerequisites for launching a future operational trial have not yet been met. Further developments to adequately visualize PPC areas on radar displays of ATC-controllers are necessary. Reduction of flight capacity is a major constraint for the whole ATM network in Europe.
6.7 Automation and data processing for operational use
It was demonstrated in an experimental environment, that the components of the D-KULT collaboration chain work together in principle. For operational use, the generation of large amounts of weather and climate data, processing and providing them in time and their integration into flight planning tools must be automated to meet existing flight planning and ATM process timelines.
6.8 Need for standardized approach and aviation-wide strategy
For air traffic management, a standardized calculation approach is of central importance to clearly identify climate-sensitive regions in the heavily frequented German airspace (and elsewhere) and evaluate avoidance strategies – taking into consideration their overall impact on airspace capacity. It should be noted that reduction of flight capacity is currently a blocking issue for the whole ATM network in Europe. Another crucial factor for successful implementation of eco-efficient flying is the development of a clear, aviation-wide strategy for dealing with contrail prevention. This requires close and coordinated collaboration among all relevant stakeholders in the aviation industry. In addition, continued fundamental research remains essential. For air traffic control, a standardized and consolidated calculation of climate sensitive regions is of central importance in this context to clearly identify where climate-relevant areas are forming in the highly frequented German/Middle-Europe airspace.
6.9 Need for robust uncertainty indicators and decision support
Despite the uncertainties, eventually given values of PPC and climate sensitivity in the Clima-X data sets have to be accepted and processed in flight route optimisation software. To support robust decisions in operational processes, the data should be accompanied by an uncertainty indicator. Concepts that determine which data support robust operational decisions are required. Comprehensive studies with large sample sizes (flights) are necessary to identify statistically significant decision thresholds.
The recommendations mentioned are to be pursued in potential future activities.
D-KULT has made the first steps from purely theoretical (numerical) trials of eco-efficient flights to eco-efficient flight planning in practice, that is, in daily operations, involving actors along the whole chain of decision-making. Such an interdisciplinary collaboration is challenging but essential to make eco-efficient flight operations feasible. The highly-interdisciplinary integrated collaboration workflow has been established, by expanding state-of-the-art procedure, data and interface, and individual components have been tested for the first time. Open research questions, remaining challenges, and operational problems have been identified and will need to be addressed in future collaboration.
The feasibility demonstrated in this study should therefore be understood as operational feasibility of the proposed workflow and associated decision-making processes. Validation of the underlying numerical climate-response models and their estimates, as well as assessment of real-world climate impacts, were beyond the scope of D-KULT.
These open research topics and challenges to be solved are inter alia:
-
The predictions of the 2-moment cloud microphysics scheme have been tested using radiosonde data which are lacking over many regions (e.g. the ocean). More data sources of relative humidity in flight levels are necessary not only for testing but in particular for assimilation into NWP models.
-
The 2-moment scheme should become operational; however, the overall calculation times should not be higher than today since the weather and climate response data need to be delivered in time.
-
New climate model simulations are necessary to widen the applicability-range of the aCCFs.
-
All response tools (not only the two used in D-KULT) need further testing and tool comparison campaigns should be performed.
-
The climate effect estimates change if different input weather data are used, also being influenced by the model capabilities to represent ice supersaturation. Inconsistencies are currently in the system, for instance if the route optimization used wind forecast data and the data on climate response functions are based on different NWP models.
-
Uncertainty quantification and characterisation should regularly be performed and an uncertainty metric should be included in the distributed Clima-X data. The ensemble forecast system can be exploited to quantify the meteorological uncertainty, and subsequently define and formulate an uncertainty metric.
-
Such a meteorological uncertainty metric can be used in a later rerouting decision. Overall, a comprehensive decision framework should be formulated which comprises a risk analysis and explores robustness of mitigation gains.
-
The expanded flight routing software tools, e.g. Lido and FPO, are prototypes.
-
The trial flights were only possible with a high level of manual work, both in flight planning and execution. An operational implementation of eco-efficient flight needs a complete automation of the process at all steps along the information chain.
-
The trial flight involved only five German airlines, which implies that contrails were avoided only partly, since other airlines did not avoid contrails. However, to avoid contrails completely in an extended PPC = 1 area can cause congestion in a heavily flown airspace with other knock-on effects, e.g. increased work-load for air traffic controllers which may be a safety problem.
As the D-KULT project is now at its end, these (and other) research needs and technical developments are topics for the near future. These steps should be taken, in order to make eco-efficient flights part of routine operations.
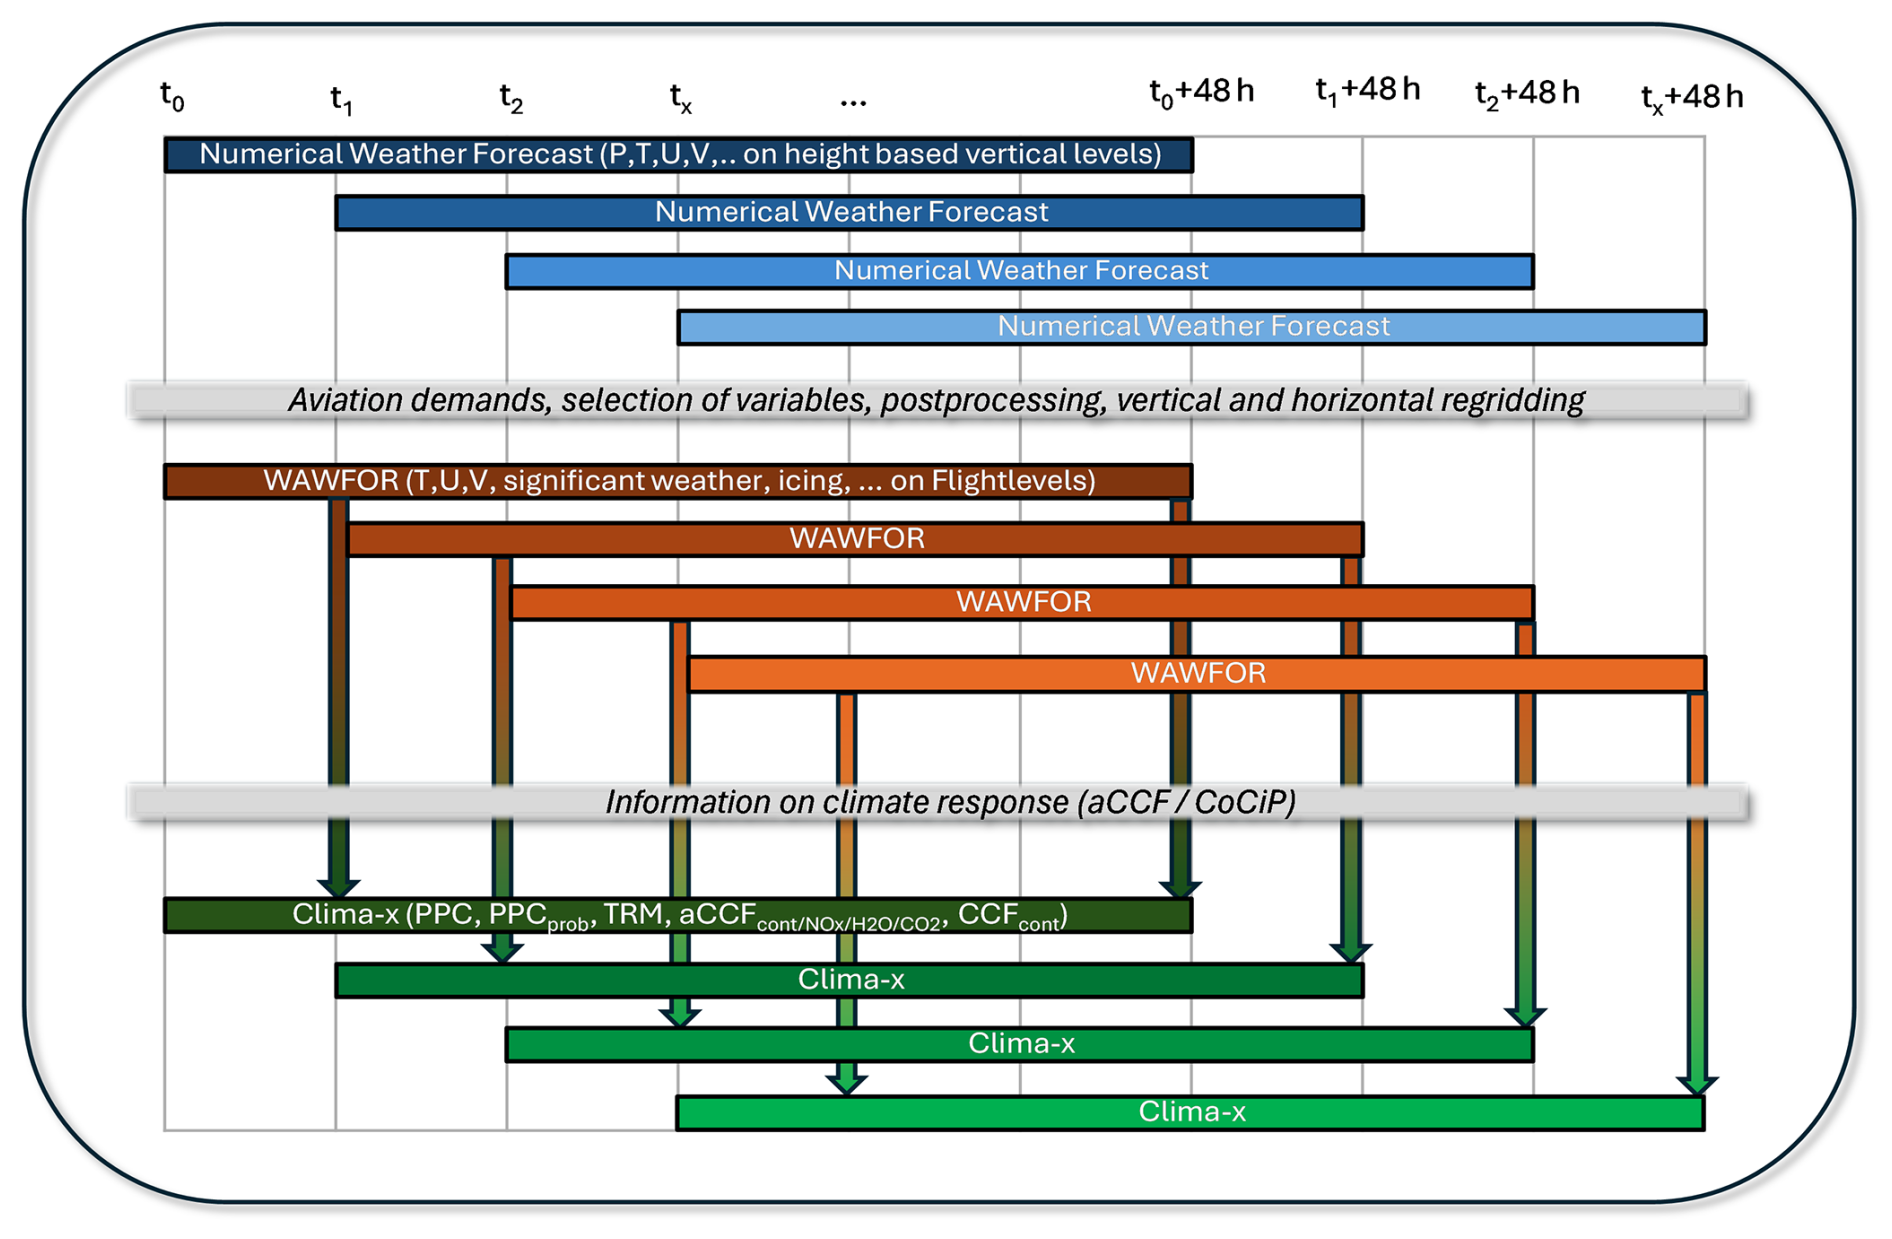
Figure A1Schematic overview of connections between Numerical Weather Forecast, WAWFOR and the Clima-X datasets.
Table A1Experimental data sets for eco-efficient flight planning containing climate response functions computed from standard or experimental numerical weather forecast.
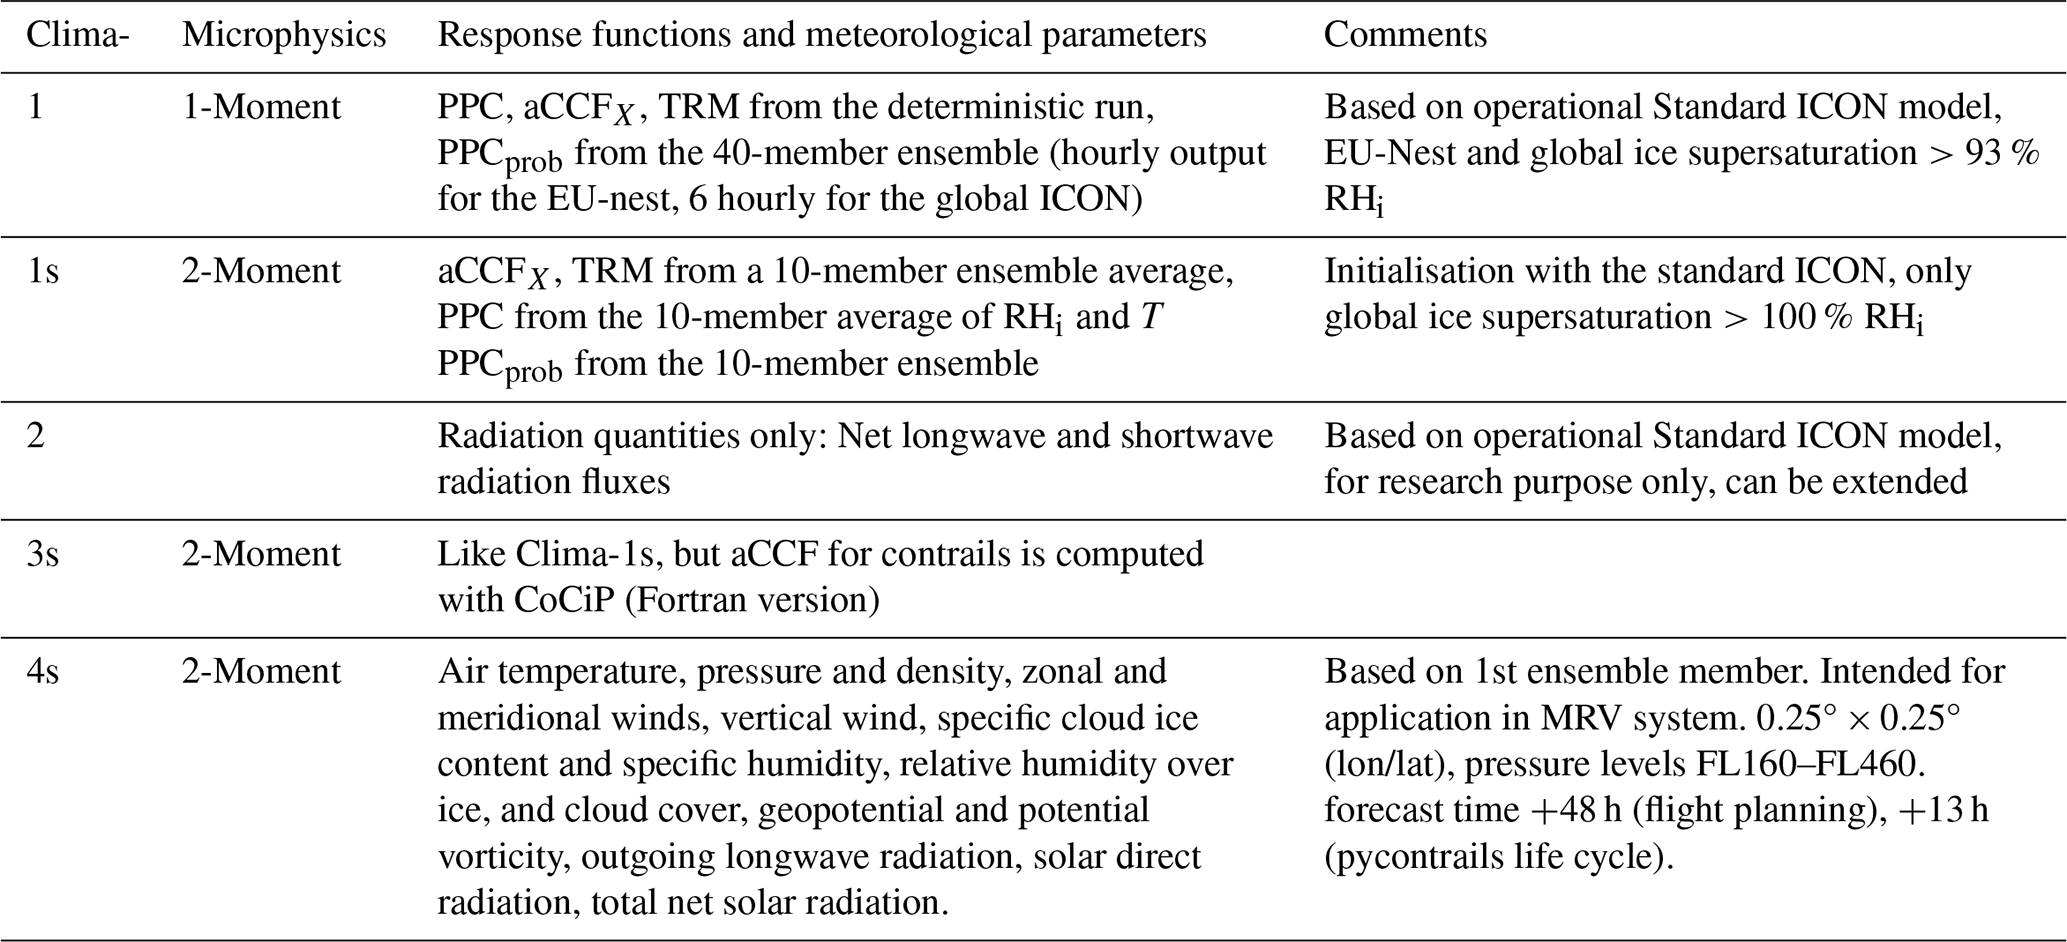
Table A2Variables contained in the experimental Clima-1, Clima-1s and Clima-3s data sets.
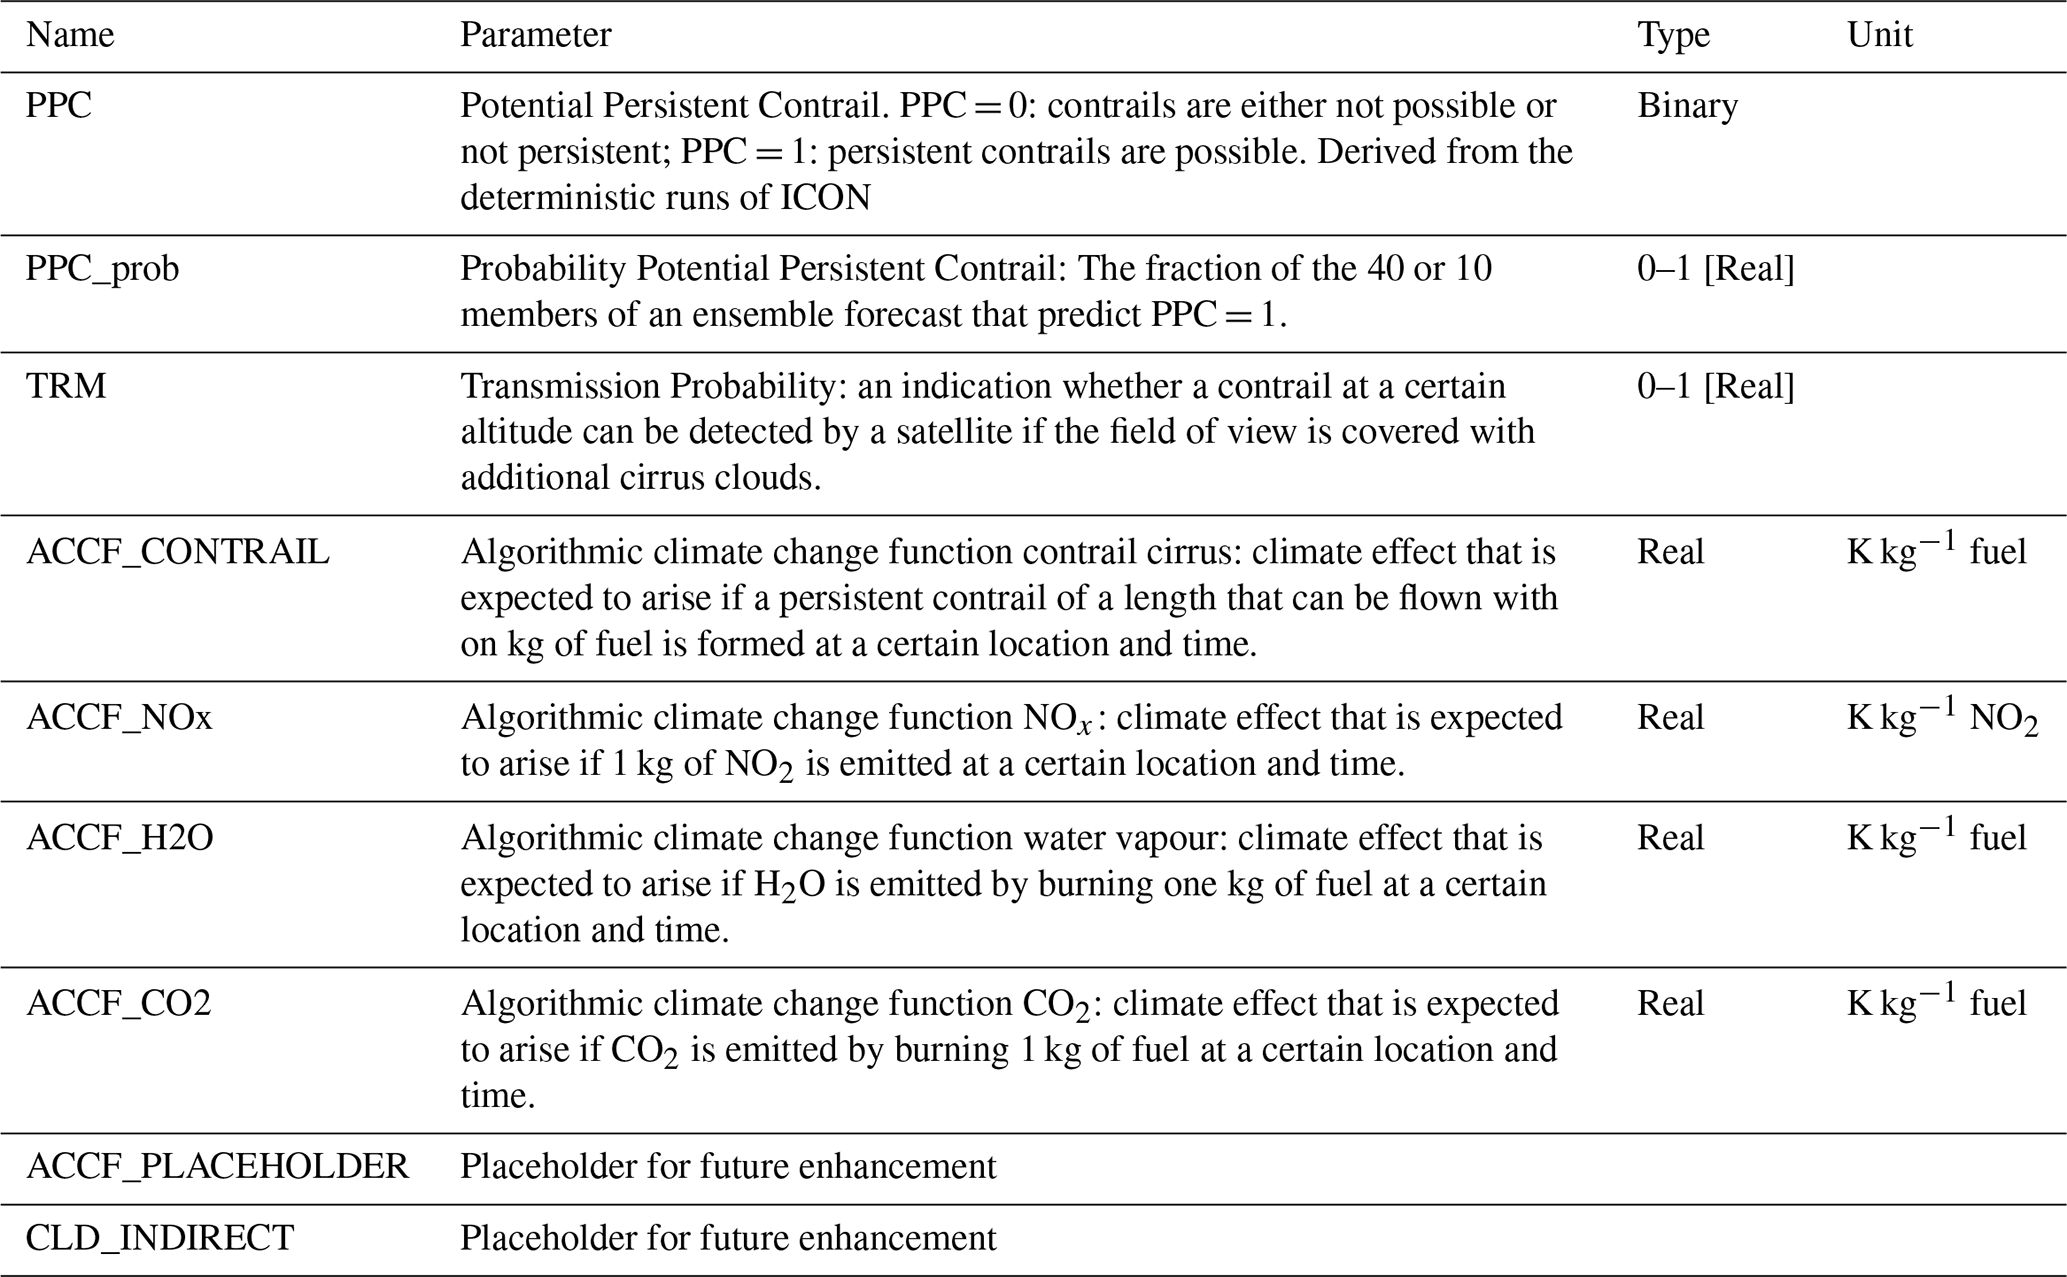
Algorithmic climate change functions (aCCFi) for each species (i) are multiplied with the respective climate metric conversion factor (CMi) for F-ATR100, climate efficacy (ri), and the alignment factor fairclim(i) as defined in Dietmüller et al. (2023) and Matthes et al. (2023) (see Table B1). The algorithm of climate response of contrails during day (aCCFcont,day) is based on the meteorological quantity of outgoing long-wave radiation (OLR) (in W m−2). The original unit of climate response function of contrails is K km−1, which is converted into K kg−1 by the factor Fkm, here we use an average specific range per kg of 0.16 km kg−1 (fuel) typical for transatlantic flights.
The algorithm of climate response of contrails at night (aCCFcont,night) is based on the temperature T (in K).
In the Clima-X data sets the contrail climate response is provided according to local day or night time as ACCF_CONTRAIL.
The algorithmic climate change function of nitrogen oxide emissions () combines the climate change functions of NOx-induced ozone (), methane () and primary mode ozone (aCCFPMO). The individual algorithmic climate response functions are described below, their composite is provided in the Clima-X datasets as ACCF_NOx. The climate response function of ozone () is based on temperature T (in K) and geopotential Φ (in m2 s−2). The output unit is temperature change per NOx emission (K kg−1 NO2).
The algorithmic climate response function of methane () is based on the meteorological variables geopotential Φ (m2 s−2) and incident solar radiation at the upper edge of the atmosphere Fin (W m−2). The output unit is temperature change per NOx emission (K kg−1 NO2).
ϑ is the solar zenith angle, φ is the latitude, and d is the declination angle of the sun, which is calculated from the ordinal number N of the day of the year.
The algorithmic climate response function of PMO (aCCFPMO) is simply calculated by:
The algorithmic climate change function of water vapour requires the potential vorticity PV in (10−6 K m2 kg−1 s−1) as meteorological input. The output unit is temperature change per kg fuel (K kg−1 fuel).
The climate change function of CO2 is not dependent on atmospheric parameters and is therefore not spatially or temporally variable. The climate change function of CO2 depends on the emission scenario (e.g. BAU = business as usual or pulse), the time horizon (e.g. 20, 50 or 100 years) and fuel consumption. The climate change function has a constant value for the chosen scenario (BAU) and a time horizon of 100 years.
Table B1AirClim alignment factors, climate metric conversion factors CMi from P-ATR20 (ATR20 for pulse emissions) to F-ATR100 (ATR100 for future emissions according BAU) and efficacy factors for contrail cirrus, ozone, methane, primary mode ozone, water vapour and carbon dioxide as used in the Clima-X data sets (see Dietmüller et al., 2023; Matthes et al., 2023).
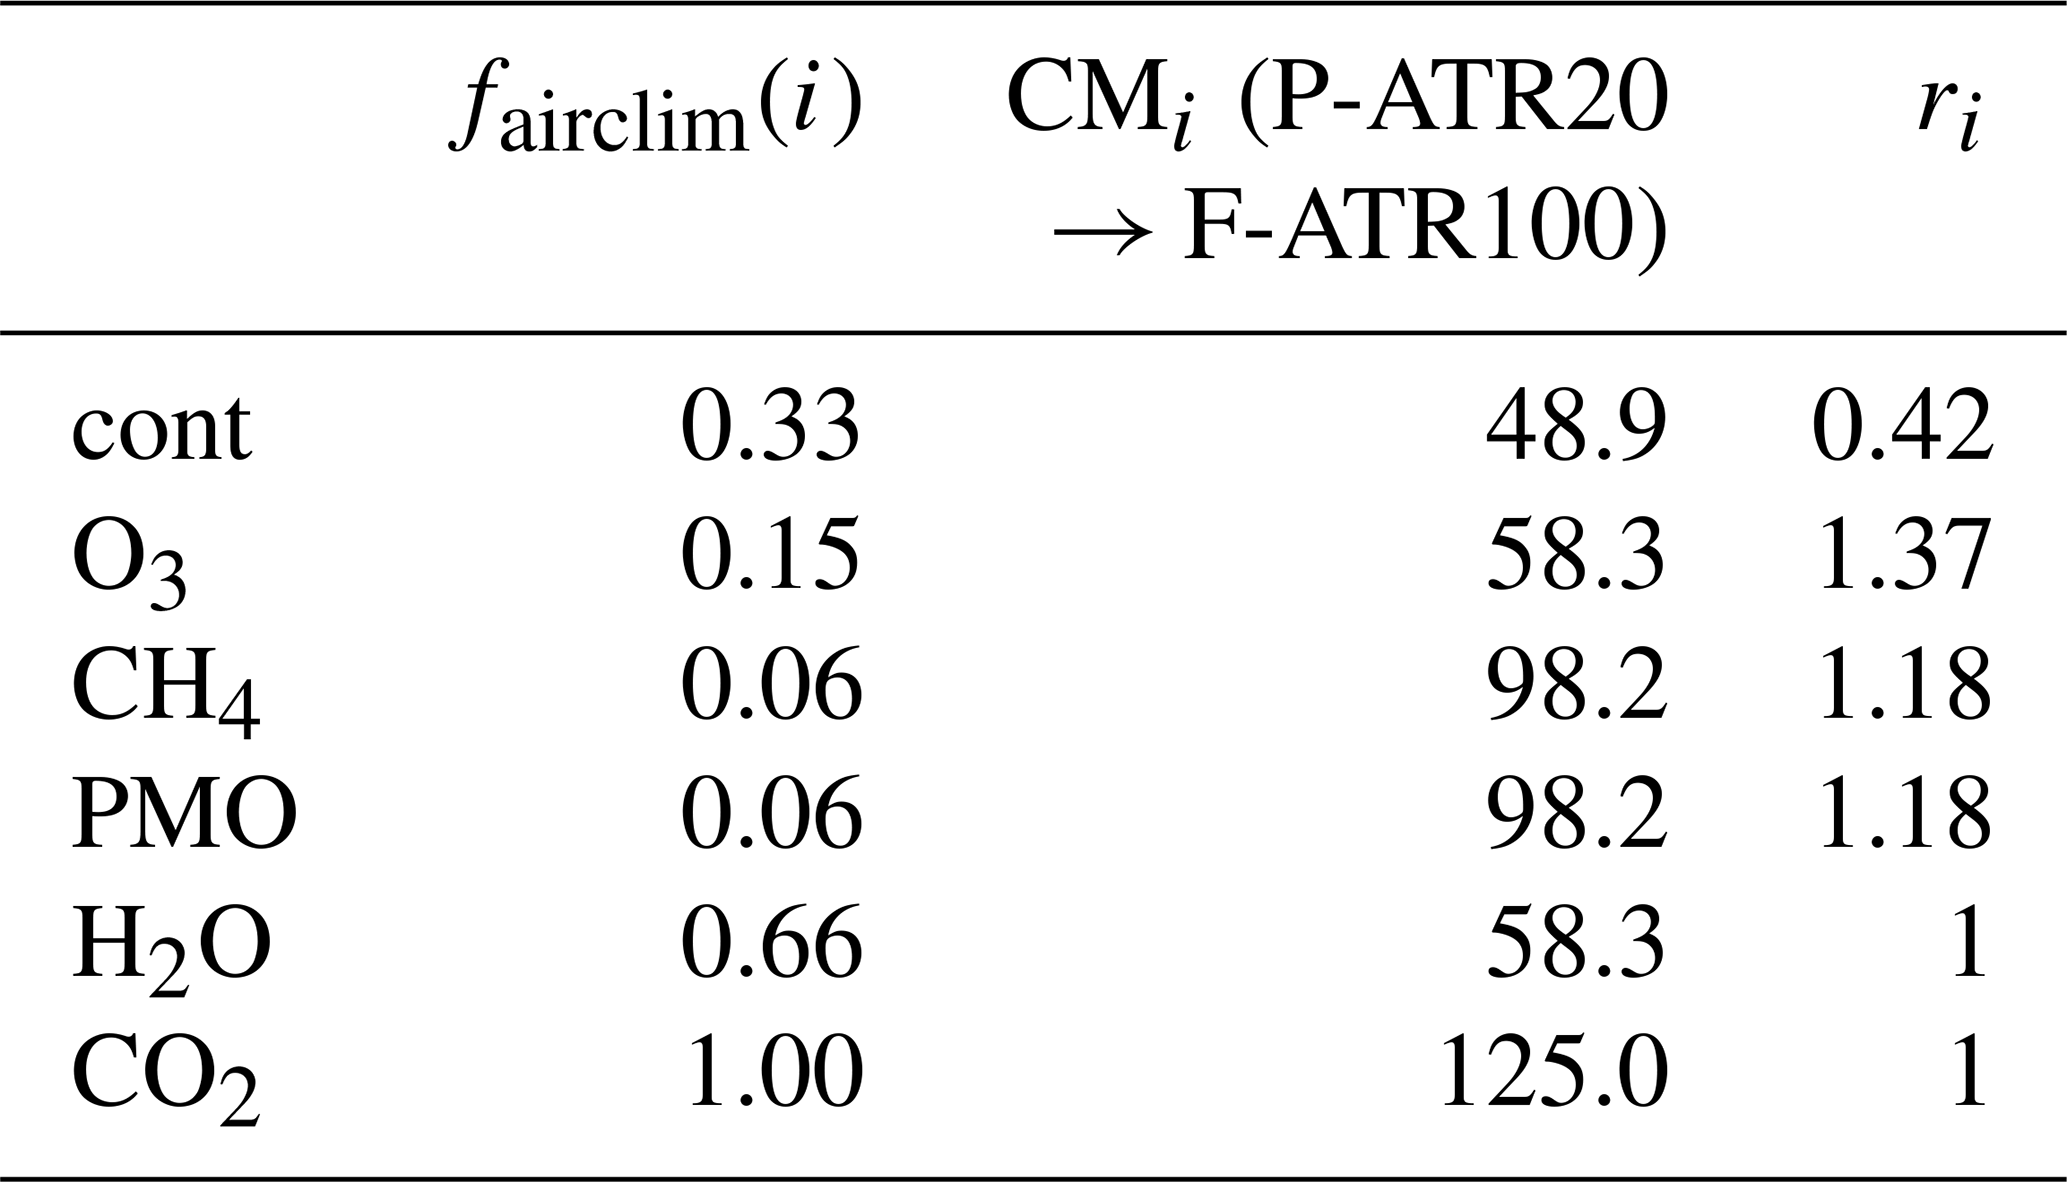
The ACCF_CONTRAIL output in Clima-3s based on CoCIP calculations is converted analogously from contrail RF to F-ATR100. A factor of 0.0151 is applied, to convert RF to P-ATR20 relating W m−2 to K (according to Yin et al., 2023), additionally, climate efficacy (rcont), and metric conversion factor CMcont from P-ATR20 to F-ATR100 were used as given in Table B1 (see Dietmüller et al., 2023). Please note that ACCF_CONTRAIL output from Clima-3s as saved on DWD servers must be multiplied by 0.244 to receive F-ATR100 as was done e.g. in Figs. 3 and 4.
This project is partly based on software that is owned by commercial companies (e.g. Lido, FPO). These codes are not publicly available. To work with the NWP code ICON, please contact Deutscher Wetterdienst. The pycontrail realisation of CoCiP is publicly available at Zenodo (https://doi.org/10.5281/zenodo.7776686; Shapiro et al., 2023). Data produced by the German weather service have been processed and are stored at the German Climate Data Centre (DKRZ). These data are available for research on written request to the coordinator, Sigrun Matthes.
All authors contributed text and figures that refer to their respective fields. SM, CF and KG produced the final draft from the individual contributions, SH checked the references. The research concept was developed during regular project meetings, involving all authors.
At least one of the (co-)authors is a member of the editorial board of Journal of Environmentally Compatible Air Transport System. The peer-review process was guided by an independent editor, and the authors also have no other competing interests to declare.
Publisher's note: Copernicus Publications remains neutral with regard to jurisdictional claims made in the text, published maps, institutional affiliations, or any other geographical representation in this paper. The authors bear the ultimate responsibility for providing appropriate place names. Views expressed in the text are those of the authors and do not necessarily reflect the views of the publisher.
The authors thank the Federal Ministry for Economic Affairs and Energy (formerly Federal Ministry for Economic Affairs and Climate Protection) for funding the D-KULT project. The project was established due to an initiative of the late Robert Sausen (1956–2025); it is a pity that he can no longer reap the fruits he has sown. We thank Michael Ponater for critically reading a draft version of the manuscript. His internal review allowed the authors to make the paper clearer and more stringent. Two anonymous reviewers made a lot of good suggestions to improve the representation quality and readability of the paper.
The D-KULT project has been funded by the Federal Ministry for Economic Affairs and Energy (formerly Federal Ministry for Economic Affairs and Climate Protection) via the Luftfahrtforschungsprogramm (LuFo VI). Each partner has its own funding number (DLR, FZK grant no. 20M2111A).
This paper was edited by Vincent R. Meijer and reviewed by two anonymous referees.
Akhtar Martínez, C., Eastham, S. D., and Jarrett, J. P.: Zero-dimensional contrail models could underpredict lifetime optical depth, Atmos. Chem. Phys., 25, 12875–12891, https://doi.org/10.5194/acp-25-12875-2025, 2025.
AKKL (Arbeitskreis Klimaneutrale Luftfahrt): Zentrale Handlungsfelder auf dem Weg zu einem Umwelt- und Klimaschonenden Luftverkehrssystem der Zukunft, Technical report, Bundesministerium für Digitales und Verkehr sowie für Wirtschaft und Klimaschutz, https://www.bdli.de/sites/default/files/2024-06/mantelpapier-ergebnisse-akkl.pdf (last access: 4 December 2024), 2024.
Arrowsmith, S., Lee, D. S., Owen, B., Faber, J., van Wijngaarden, L., Boucher, O., Celikel, A., Deransy, R., Fuglestvedt, J., Laukia, J., Tronstad Lund, M., Sausen, R., Schaefer, M., Skowron, A., Stromatas, S., and Watt, A.: Updated analysis of the non-CO2 climate impacts of aviation and potential policy measures pursuant to the EU Emissions Trading System Directive Article 30, EASA-Report, 115 pp., https://www.easa.europa.eu/en/downloads/120860/en (last access: 12 January 2026), 2020.
Borella, A., Boucher, O., Shine, K. P., Stettler, M., Tanaka, K., Teoh, R., and Bellouin, N.: The importance of an informed choice of CO2-equivalence metrics for contrail avoidance, Atmos. Chem. Phys., 24, 9401–9417, https://doi.org/10.5194/acp-24-9401-2024, 2024.
Chevallier, R., Shapiro, M., Engberg, Z., Soler, M., and Delahaye, D.: Linear contrails detection, tracking and matching with aircraft using geostationary satellite and air traffic data, Aerospace, 10, 578, https://doi.org/10.3390/aerospace10070578, 2023.
Dahlmann, K., Matthes, S., and Grewe, V.: Conversion factors from radiative forcing to aviation climate metrics, Meteorol. Z., early online access, https://doi.org/10.1127/metz/1288, 2026.
Dekoutsidis, G., Groß, S., Wirth, M., Krämer, M., and Rolf, C.: Characteristics of supersaturation in midlatitude cirrus clouds and their adjacent cloud-free air, Atmos. Chem. Phys., 23, 3103–3117, https://doi.org/10.5194/acp-23-3103-2023, 2023.
Dietmüller, S., Matthes, S., Dahlmann, K., Yamashita, H., Simorgh, A., Soler, M., Linke, F., Lührs, B., Meuser, M. M., Weder, C., Grewe, V., Yin, F., and Castino, F.: A Python library for computing individual and merged non-CO2 algorithmic climate change functions: CLIMaCCF V1.0, Geosci. Model Dev., 16, 4405–4425, https://doi.org/10.5194/gmd-16-4405-2023, 2023.
Dietmüller, S., Matthes, S., Peter, P., Kirschler., S., and Piontek, D.: Night-time contrail response over North Atlantic flight corridor: a model inter-comparison of contrail aCCF and grid-based CoCiP, Meteorol. Z., in preparation, 2026.
DuBois, D. and Paynter, G. C.: `Fuel Flow Method2' for Estimating Aircraft Emissions, SAE Trans., 115, 1–14, 2006.
Duda, D. P., Minnis, P., Nguyen, L., and Palikonda, R.: A Case Study of the Development of Contrail Clusters over the Great Lakes, J. Atmos. Sci., 61, 1132–1146, https://doi.org/10.1175/1520-0469(2004)061<1132:ACSOTD>2.0.CO;2, 2004.
Duda, D. P., Minnis, P., Khlopenkov, K., Chee, T. L., and Boeke, R.: Estimation of 2006 Northern Hemisphere contrail coverage using MODIS data, Geophys. Res. Lett., 40, 612–617, https://doi.org/10.1002/grl.50097, 2013.
Engberg, Z., Teoh, R., Abbott, T., Dean, T., Stettler, M. E. J., and Shapiro, M. L.: Forecasting contrail climate forcing for flight planning and air traffic management applications: the CocipGrid model in pycontrails 0.51.0, Geosci. Model Dev., 18, 253–286, https://doi.org/10.5194/gmd-18-253-2025, 2025.
Fichter, C., Marquart, S., Sausen, R., and Lee, D. S.: The impact of cruise altitude on contrails and related radiative forcing, Meteorol. Z., 14, 563–572, https://doi.org/10.1175/1520-0469(2004)061<1132:ACSOTD>2.0.CO;2, 2005.
Frömming, C., Ponater, M., Dahlmann, K., Grewe, V., Lee, D. S., and Sausen, R.: Aviation-induced radiative forcing and surface temperature change in dependency of the emission altitude, J. Geophys. Res., 117, D19104, https://doi.org/10.1029/2012JD018204, 2012.
Frömming, C., Grewe, V., Brinkop, S., Jöckel, P., Haslerud, A. S., Rosanka, S., van Manen, J., and Matthes, S.: Influence of weather situation on non-CO2 aviation climate effects: the REACT4C climate change functions, Atmos. Chem. Phys., 21, 9151–9172, https://doi.org/10.5194/acp-21-9151-2021, 2021.
Frömming, C., Grewe, V., Matthes, S., Dietmüller, S., Peter, P., Dahlmann, K., and Jöckel, P.: Expanding spatial and temporal coverage of climate change functions: Assessment and comparison with aCCFs, J. Env. Com. Air Transp. Sys. Discuss. [preprint], https://doi.org/10.5194/jecats-2026-7, in review, 2026.
Gierens, K.: Transmission formulation for random stacks of clouds, Meteorol. Z., 33, 51–54, https://doi.org/10.1127/metz/2023/1186, 2023.
Gierens, K.: The utility of partial contrail avoidance, Meteorol. Z., early online, https://doi.org/10.1127/metz/1275, 2025.
Gierens, K. M. and Vázquez-Navarro, M.: Statistical analysis of contrail lifetimes from a satellite perspective, Meteorol. Z., 27, 183–193, https://doi.org/10.1127/metz/2018/0888, 2018.
Gierens, K., Matthes, S., and Rohs, S.: How Well Can Persistent Contrails Be Predicted?, Aerospace, 7, 169, https://doi.org/10.3390/aerospace7120169, 2020.
Gierens, K., Wilhelm, L., Hofer, S., and Rohs, S.: The effect of ice supersaturation and thin cirrus on lapse rates in the upper troposphere, Atmos. Chem. Phys., 22, 7699–7712, https://doi.org/10.5194/acp-22-7699-2022, 2022.
Grewe, V., Frömming, C., Matthes, S., Brinkop, S., Ponater, M., Dietmüller, S., Jöckel, P., Garny, H., Tsati, E., Dahlmann, K., Søvde, O. A., Fuglestvedt, J., Berntsen, T. K., Shine, K. P., Irvine, E. A., Champougny, T., and Hullah, P.: Aircraft routing with minimal climate impact: the REACT4C climate cost function modelling approach (V1.0), Geosci. Model Dev., 7, 175–201, https://doi.org/10.5194/gmd-7-175-2014, 2014.
Grewe, V., Matthes, S., Frömming, C., Brinkop, S., Jöckel, P., Gierens, K. M., Champougny, T., Fuglestvedt, J., Haslerud, A., Irvine, E. A., and Shine, K.: Feasibility of climate-optimized air traffic routing for trans-Atlantic flights, Environ. Res. Lett., 12, 34003, https://doi.org/10.1088/1748-9326/aa5ba0, 2017.
Grewe, V., Gangoli Rao, A., Grönstedt, T., Xisto, C., Linke, F., Melkert, J., Middel, J., Ohlenforst, B., Blakey, S., Christie, S., Matthes, S., and Dahlmann, K.: Evaluating the climate impact of aviation emission scenarios towards the Paris agreement including COVID-19 effects, Nat. Commun., 12, 3841, https://doi.org/10.1038/s41467-021-24091-y, 2021.
Hanst, M., Köhler, C. G., Seifert, A., and Schlemmer, L.: Predicting ice supersaturation for contrail avoidance: ensemble forecasting using ICON with two-moment ice microphysics, Atmos. Chem. Phys., 25, 17253–17274, https://doi.org/10.5194/acp-25-17253-2025, 2025.
Hofer, S., Gierens, K., and Rohs, S.: How well can persistent contrails be predicted? An update, Atmos. Chem. Phys., 24, 7911–7925, https://doi.org/10.5194/acp-24-7911-2024, 2024.
International Council of Clean Transportation (ICCT): Aviation Vision 2050: The potential for climate-neutral growth, https://theicct.org/publication/aviation-vision-2050-sept25/ (last access: 2 October 2026), 2025.
International Transport Forum (ITF): Transport Outlook 2012: Seamless Transport for Greener Growth, https://www.itf-oecd.org/sites/default/files/docs/12outlook.pdf (last access: 29 January 2026), 2012.
Klöwer, M., Allen, M. R., Lee, D. S., Proud, S. R., Gallagher, L., and Skowron, A.: Quantifying aviation's contribution to global warming, Environ. Res. Lett., 16, 104027, https://doi.org/10.1088/1748-9326/ac286e, 2021.
Köhler, C. G. and Seifert, A.: Identifying sensitivities for cirrus modelling using a two-moment two-mode bulk microphysics scheme, Tellus B, 67, 24494, https://doi.org/10.3402/tellusb.v67.24494, 2015.
Kulik, L.: Satellite-based detection of contrails using deep learning, Ph.D. thesis, Massachusetts Institute of Technology, 2019.
Lau, A., Ehlers, T., Derra, M., and Lührs, B.: Considerations for multi-criteria Route Design on Different Atmospheric Scales, Proc. 33rd ICAS Congress, Stockholm, Sweden, 4–9 September 2022, https://www.icas.org/icas_archive/ICAS2022/data/papers/ICAS2022_0844_paper.pdf (last access: 12 January 2026), 2022.
Lee, D. S., Pitari, G., Grewe, V., Gierens, K., Penner, J. E., Petzold, A., Prather, M. J., Schumann, U., Bais, A., Berntsen, T., Iachetti, D., Lim, L. L., and Sausen, R.: Transport impacts on atmosphere and climate: Aviation, Atmos. Environ., 44, 4678–4734, https://doi.org/10.1016/j.atmosenv.2009.06.005, 2010.
Lee, D. S., Fahey, D. W., Skowron, A., Allen, M. R., Burkhardt, U., Chen, Q., Doherty, S. J., Freeman, S., Forster, P. M., Fuglestvedt, J., Gettelman, A., DeLeon, R. R., Lim, L. L., Lund, M. T., Millar, T. J., Owen, B., Penner, J. E., Pitari, G., Prather, M. J., Sausen, R., and Wilcox, L. J.: The contribution of global aviation to anthropogenic climate forcing for 2000 to 2018, Atmos. Environ., 244, 117834, https://doi.org/10.1016/j.atmosenv.2020.117834, 2021.
Linke, F.: Ökologische Analyse operationeller Lufttransportkonzepte, DLR-Forschungsbericht DLR-FB-2016-10, Dissertation, Technische Universität Hamburg-Harburg, https://elib.dlr.de/103182/ (last access: 2 October 2026), 2016.
Lührs, B., Niklaß, M., Frömming, C., Grewe, V., and Gollnick, V.: Cost-Benefit Assessment of 2D and 3D Climate and Weather Optimized Trajectories, 16th AIAA Aviation Technology, Integration, and Operations Conference (ATIO), Washington, DC, USA, https://doi.org/10.2514/6.2016-3758, 2016.
Lührs, B., Gollnick, V., Niklaß, M., Frömming, C., and Grewe, V.: Cost–benefit assessment of climate and weather optimized trajectories for different North Atlantic weather patterns, Proc. 31st ICAS Congress, Belo Horizonte, Brazil, 9–14 September 2018, https://www.icas.org/icas_archive/ICAS2018/data/papers/ICAS2018_0708_paper.pdf (last access: 3 June 2025), 2018.
Mannstein, H., Meyer, R., and Wendling, P.: Operational Detection of Contrails from NOAA-AVHRR-Data, Int. J. Remote Sens., 20, 1641–1660, https://doi.org/10.1016/j.atmosenv.2020.117834, 1999.
Mannstein, H., Brömser, A., and Bugliaro, L.: Ground-based observations for the validation of contrails and cirrus detection in satellite imagery, Atmos. Meas. Tech., 3, 655–669, https://doi.org/10.5194/amt-3-655-2010, 2010.
Märkl, R. S., Voigt, C., Sauer, D., Dischl, R. K., Kaufmann, S., Harlaß, T., Hahn, V., Roiger, A., Weiß-Rehm, C., Burkhardt, U., Schumann, U., Marsing, A., Scheibe, M., Dörnbrack, A., Renard, C., Gauthier, M., Swann, P., Madden, P., Luff, D., Sallinen, R., Schripp, T., and Le Clercq, P.: Powering aircraft with 100
Matthes, S., Schumann, U., Grewe, V., Frömming, C., Dahlmann, K., Koch, A., and Mannstein, H.: Climate optimized air transport, in: Atmospheric Physics: Background – Methods – Trends, Research Topics in Aerospace, Springer, 727–746, ISBN 978-3-642-30182-7, 2012.
Matthes, S., Lührs, B., Dahlmann, K., Grewe, V., Linke, F., Yin, F., Klingaman, E., and Shine, K. P.: Climate-Optimized Trajectories and Robust Mitigation Potential: Flying ATM4E, Aerospace, 7, 156, https://doi.org/10.3390/aerospace7110156, 2020.
Matthes, S., Lim, L., Burkhardt, U., Dahlmann, K., Dietmüller, S., Grewe, V., Haslerud, A. S., Hendricks, J., Owen, B., Pitari, G., Righi, M., and Skowron, A.: Mitigation of Non-CO2 Aviation's Climate Impact by Changing Cruise Altitudes, Aerospace, 8, 36, https://doi.org/10.3390/aerospace8020036, 2021.
Matthes, S., Dietmüller, S., Dahlmann, K., Frömming, C., Peter, P., Yamashita, H., Grewe, V., Yin, F., and Castino, F.: Updated algorithmic climate change functions (aCCF) V1.0A: Evaluation with the climate-response model AirClim V2.0, Geosci. Model Dev. Discuss. [preprint], https://doi.org/10.5194/gmd-2023-92, 2023.
Megill, L., Deck, K., and Grewe, V.: Alternative climate metrics to the Global Warming Potential are more suitable for assessing aviation non-CO2 effects, Commun. Earth Environ., 5, 249, https://doi.org/10.1038/s43247-024-01423-6, 2024.
Meijer, V. R., Kulik, L., Eastham, S. D., Allroggen, F., Speth, R. L., Karaman, S., and Barrett, S. R.: Contrail coverage over the United States before and during the COVID-19 pandemic, Environ. Res. Lett., 17, 034039, https://doi.org/10.1088/1748-9326/ac26f0, 2022.
Ng, J. Y.-H., McCloskey, K., Cui, J., Meijer, V. R., Brand, E., Sarna, A., Goyal, N., Van Arsdale, C., and Geraedts, S.: Contrail Detection on GOES-16 ABI With the OpenContrails Dataset, IEEE T. Geosci. Remote, 62, 1–14, https://doi.org/10.1109/TGRS.2023.3345226, 2024.
Nuic, A. and Mouillet, V.: User manual for the base of aircraft data (BADA) family 4, EUROCONTROL Technical Report, 12, 22–58, https://www.eurocontrol.int/publication/user-manual-base-aircraft-data-bada (last access: 12 January 2026), 2012.
Peter, P., Matthes, S., Frömming, C., Jöckel, P., Bugliaro, L., Giez, A., Krämer, M., and Grewe, V.: Influence of temperature and humidity on contrail formation regions in the general circulation model EMAC: a spring case study, Atmos. Chem. Phys., 25, 5911–5934, https://doi.org/10.5194/acp-25-5911-2025, 2025.
Peter, P., Matthes, S., and Zengerling, Z.: Sensitivity of contrail-avoidance to meteorology and climate response models during the D-KULT trial flights (TF-100), Meteorol. Z., in review, 2026.
Poll, D. I. A. and Schumann, U.: An estimation method for the fuel burn and other performance characteristics of civil transport aircraft during cruise: part 2, determining the aircraft's characteristic parameters, Aeronaut. J., 125, 296–340, https://doi.org/10.1017/aer.2020.124, 2021.
Rao, P., Yin, F., Grewe, V., Yamashita, H., Jöckel, P., Matthes, S., Mertens, M., and Frömming, C.: Case Study for Testing the Validity of NOx-Ozone Algorithmic Climate Change Functions for Optimising Flight Trajectories, Aerospace, 9, 231, https://doi.org/10.3390/aerospace9050231, 2022.
Santos Gabriel, V., Bugliaro, L., Montag, M., Ries, S., Wang, Z., Widmaier, K., Arico, M., Unterstrasser, S., Mayer, J., Menekay, D., Marsing, A., de la Torre Castro, E., Megill, L., Scheibe, M., and Voigt, C.: A manually labeled contrail dataset from MSG/SEVIRI, Earth Syst. Sci. Data, 18, 2397–2412, https://doi.org/10.5194/essd-18-2397-2026, 2026a.
Sausen, R., Nodorp, D., and Land, C.: Towards an optimal flight routing with respect to minimal environmental impact. In: Impact of Emissions from Aircraft and Spacecraft upon the Atmosphere, ed. by: Schumann, U. and Wurzel, D., Proceedings of an International Scientific Colloquium, Köln, Germany, 18–20 April 1994, DLR Mitteilung 94-06, Oberpfaffenhofen and Köln, 473–478, https://elib.dlr.de/32348/ (last access: 2 October 2026), 1994.
Sausen, R., Nodorp, D., Land, C., and Deidewig, F.: Ermittlung optimaler Flughöhen und Flugrouten unter dem Aspekt minimaler Klimawirksamkeit, DLR-Forschungsbericht 96–13, 105 pp., https://elib.dlr.de/32161/ (last access: 2 October 2026), 1996.
Schmetz, J., Pili, P., Tjemkes, S., Just, D., Kerkmann, J., Rota, S., and Ratier, A.: An introduction to Meteosat Second Generation (MSG), B. Am. Meteorol. Soc., 83, 977–992, https://doi.org/10.1175/1520-0477(2002)083<0977:AITMSG>2.3.CO;2, 2002.
Schumann, U.: On the effect of emissions from aircraft engines on the state of the atmosphere, Ann. Geophys., 12, 365–384, https://doi.org/10.1007/s00585-994-0365-0, 1994.
Schumann, U.: On conditions for contrail formation from aircraft exhausts, Meteorol. Z., 5, 4–23, https://doi.org/10.3390/aerospace9050231, 1996.
Schumann, U.: A contrail cirrus prediction model, Geosci. Model Dev., 5, 543–580, https://doi.org/10.5194/gmd-5-543-2012, 2012.
Schumann, U. and Graf, K.: Aviation-induced cirrus and radiation changes at diurnal timescales, J. Geophys. Res.-Atmos., 118, 2404–2421, https://doi.org/10.1002/jgrd.50184, 2013.
Schumann, U., Mayer, B., Graf, K., and Mannstein, H.: A parametric radiative forcing model for contrail cirrus, J. Appl. Meteorol. Climatol., 51, 1391–1406, https://doi.org/10.1175/JAMC-D-11-0242.1, 2012.
Schumann, U., Baumann, R., Baumgardner, D., Bedka, S. T., Duda, D. P., Freudenthaler, V., Gayet, J.-F., Heymsfield, A. J., Minnis, P., Quante, M., Raschke, E., Schlager, H., Vázquez-Navarro, M., Voigt, C., and Wang, Z.: Properties of individual contrails: a compilation of observations and some comparisons, Atmos. Chem. Phys., 17, 403–438, https://doi.org/10.5194/acp-17-403-2017, 2017.
Schumann, U., Bugliaro, L., Dörnbrack, A., Baumann, R., and Voigt, C.: Aviation contrail cirrus and radiative forcing over Europe during 6 months of COVID-19, Geophys. Res. Lett., 48, e2021GL092771, https://doi.org/10.1029/2021GL092771, 2021.
Shapiro, M., Engberg, Z., Teoh, R., and Dean, T.: pycontrails: Python library for modeling aviation climate impacts (Version v0.39.4), Zenodo [software], https://doi.org/10.5281/zenodo.7776686, 2023.
Simorgh, A., Soler, M., González-Arribas, D., Matthes, S., Grewe, V., Dietmüller, S., Baumann, S., Yamashita, H., Yin, F., Castino, F., Linke, F., Lührs, B., and Mendiguchia Meuser, M.: A Comprehensive Survey on Climate Optimal Aircraft Trajectory Planning, Aerospace, 9, 146, https://doi.org/10.3390/aerospace9030146, 2022.
Sperber, D. and Gierens, K.: Towards a more reliable forecast of ice supersaturation: concept of a one-moment ice-cloud scheme that avoids saturation adjustment, Atmos. Chem. Phys., 23, 15609–15627, https://doi.org/10.5194/acp-23-15609-2023, 2023.
Teoh, R., Schumann, U., Majumdar, A., and Stettler, M. E. J.: Mitigating the climate forcing of aircraft contrails by small-scale diversions and technology adoption, Environ. Sci. Technol., 54, 2941–2950, https://doi.org/10.1021/acs.est.9b05608, 2020.
Teoh, R., Engberg, Z., Schumann, U., Voigt, C., Shapiro, M., Rohs, S., and Stettler, M. E. J.: Global aviation contrail climate effects from 2019 to 2021, Atmos. Chem. Phys., 24, 6071–6093, https://doi.org/10.5194/acp-24-6071-2024, 2024.
United Nations: UN Framework Convention on Climate Change, Adoption of the Paris Agreement, Conference of Parties, Twenty-first session Paris, FCCC/CP/2015/L.9/Rev.1, 30 November to 11 December 2015, 2015.
van Manen, J. and Grewe, V.: Algorithmic climate change functions for the use in eco-efficient flight planning, Transp. Res. Part D, 67, 388–405, https://doi.org/10.1016/j.trd.2018.12.016, 2019.
Vázquez-Navarro, M., Mannstein, H., and Kox, S.: Contrail life cycle and properties from 1 year of MSG/SEVIRI rapid-scan images, Atmos. Chem. Phys., 15, 8739–8749, https://doi.org/10.5194/acp-15-8739-2015, 2015.
Voigt, C., Schumann, U., Jurkat, T., Schäuble, D., Schlager, H., Petzold, A., Gayet, J.-F., Krämer, M., Schneider, J., Borrmann, S., Schmale, J., Jessberger, P., Hamburger, T., Lichtenstern, M., Scheibe, M., Gourbeyre, C., Meyer, J., Kübbeler, M., Frey, W., Kalesse, H., Butler, T., Lawrence, M. G., Holzäpfel, F., Arnold, F., Wendisch, M., Döpelheuer, A., Gottschaldt, K., Baumann, R., Zöger, M., Sölch, I., Rautenhaus, M., and Dörnbrack, A.: In-situ observations of young contrails – overview and selected results from the CONCERT campaign, Atmos. Chem. Phys., 10, 9039–9056, https://doi.org/10.5194/acp-10-9039-2010, 2010.
Voigt, C., Schumann, U., Minikin, A., Abdelmonem, A., Afchine, A., Borrmann, S., Boettcher, M., Buchholz, B., Bugliaro, L., Costa, A., Curtius, J., Dollner, M., Dörnbrack, A., Dreiling, V., Ebert, V., Ehrlich, A., Fix, A., Forster, L., Frank, F., Fütterer, D., Giez, A., Graf, K., Grooß, J.-U., Groß, S., Heimerl, K., Heinold, B., Hüneke, T., Järvinen, E., Jurkat, T., Kaufmann, S., Kenntner, M., Klingebiel, M., Klimach, T., Kohl, R., Krämer, M., Krisna, T.C., Luebke, A., Mayer, B., Mertes, S., Molleker, S., Petzold, A., Pfeilsticker, K., Port, M., Rapp, M., Reutter, P., Rolf, C., Rose, D., Sauer, D., Schäfler, A., Schlage, R., Schnaiter, M., Schneider, J., Spelten, N., Spichtinger, P, Stock, P., Walser, A., Weigel, R., Weinzierl, B., Wendisch, M., Werner, F., Wernli, H., Wirth, M., Zahn, A., Ziereis, H., and Zöger, M.: ML-CIRRUS: The Airborne Experiment on Natural Cirrus and Contrail Cirrus with the High-Altitude Long-Range Research Aircraft HALO, B. Am. Meteorol. Soc., 98, 271–288, https://doi.org/10.1175/BAMS-D-15-00213.1, 2017.
Voigt, C., Lelieveld, J., Schlager, H., Schneider, J., Curtius, J., Meerkötter, R., Sauer, D., Bugliaro, L., Bohn, B., Crowley, J. N., Erbertseder, T., Groß, S., Hahn, V., Li, Q., Mertens, M., Pöhlker, M. L., Pozzer, A., Schumann, U., Tomsche, L., Williams, J., Zahn, A., Andreae, M., Borrmann, S., Bräuer, T., Dörich, R., Dörnbrack, A., Edtbauer, A., Ernle, L., Fischer, H., Giez, A., Granzin, M., Grewe, V., Harder, H., Heinritzi, M., Holanda, B. A., Jöckel, P., Kaiser, K., Krüger, O. O., Lucke, J., Marsing, A., Martin, A., Matthes, S., Pöhlker, C., Pöschl, U., Reifenberg, S., Ringsdorf, A., Scheibe, M., Tadic, I., Zauner-Wieczorek, M., Henke, R., and Rapp, M.: Cleaner Skies during the COVID-19 Lockdown, B. Am. Meteorol. Soc., 103, E1796–E1827, https://doi.org/10.1175/BAMS-D-21-0012.1, 2022.
von Bonhorst, G.: Stability assessment of forecasts regarding ice supersaturation and persistent contrails, Master's thesis, Ludwig-Maximilians-Universität München, https://elib.dlr.de/213011/ (last access: 2 October 2026), 2024.
von Bonhorst, G., Maizet, M., and Gierens, K.: On contrail prediction under realistic weather forecast uncertainty, Meteorol. Z., early online, https://doi.org/10.1127/metz/1251, 2025.
von Koslowski, V. L. and Gierens, K.: Characteristics of robust and non-robust days for contrail forecasts, Meteorol. Z., in press, 2026.
Williams, V., Noland, R. B., and Toumi, R.: Reducing the climate change impacts of aviation by restricting cruise altitudes, Transp. Res. Part D, 7, 451–464, https://doi.org/10.1016/S1361-9209(02)00013-5, 2002.
Williams, V., Noland, R. B., and Toumi, R.: Air transport cruise altitude restrictions to minimize contrail formation, Clim. Policy, 3, 207–219, https://doi.org/10.3763/cpol.2003.0328, 2003.
Yamashita, H., Yin, F., Grewe, V., Patrick, P., Matthes, S., Kern, B., Dahlmann, K., and Frömming, C.: Analysis of aircraft routing strategies for North Atlantic flights by using AirTraf 2.0, Aerospace, 8, 33, https://doi.org/10.3390/aerospace8020033, 2021.
Yin, F., Grewe, V., Castino, F., Rao, P., Matthes, S., Dahlmann, K., Dietmüller, S., Frömming, C., Yamashita, H., Peter, P., Klingaman, E., Shine, K. P., Lührs, B., and Linke, F.: Predicting the climate impact of aviation for en-route emissions: the algorithmic climate change function submodel ACCF 1.0 of EMAC 2.53, Geosci. Model Dev., 16, 3313–3334, https://doi.org/10.5194/gmd-16-3313-2023, 2023.
Zängl, G., Reinert, D., Ripodas, P., and Baldauf, M.: The ICON (ICOsahedral non-hydrostatic) modelling framework of DWD and MPI-M: Description of the non-hydrostatic dynamical core, Q. J. Roy. Meteor. Soc., 141, 563–579, https://doi.org/10.1002/qj.2378, 2015.
Zengerling, Z., Linke, F., Weder, C., and Dahlmann, K.: Climate-Optimised Intermediate Stop Operations: Mitigation Potential and Differences from Fuel-Optimised Configuration, Appl. Sci., 12, 12499, https://doi.org/10.3390/app122312499, 2022.
Zhang, G., Zhang, J., and Shang, J.: Contrail recognition with convolutional neural network and contrail parameterizations evaluation, SOLA, 14, 132–137, https://doi.org/10.2151/sola.2018-023, 2018.
- Abstract
- Introduction
- Integrated collaboration chain for eco-efficient flight planning
- Aviation weather forecast and climate response calculation
- Flight planning, trajectory optimization and air traffic control
- Contrail detection and validation of contrail avoidance
- Achievements and discussion of necessary further development steps
- Concluding remarks
- Appendix A
- Appendix B
- Code and data availability
- Author contributions
- Competing interests
- Disclaimer
- Acknowledgements
- Financial support
- Review statement
- References